
Seaborn is a data visualization library that lets you build complex statistical visualizations in a simple way. One of the great things is the ability to easily add subplots in Seaborn. In this tutorial, you’ll learn how to create multi-plot grids using the Seaborn FacetGrid and subplots. Because Seaborn is intended to make complex things simple, Seaborn has high-level functions to make creating grids of graphs simple.
By the end of this tutorial, you’ll have learned the following:
- How to add rows and columns or data to a Seaborn graph to create subplots
- How the Seaborn FacetGrid object works and how you can use it
Table of Contents
Creating Small Multiples (Subplots) With Seaborn
Seaborn makes it very simple to add multiple subplots to a graph with the col=, row=, and hue= parameters. These parameters allow you to add small multiples of graphs in the rows and columns of the larger graph figure to split data further into these categories. This allows you to create visualizations like the one below:

As you’ll learn in a later section, these visualizations are built on top of the FacetGrid. Because of this, you need to use Seaborn figure-level functions, which include the following:
sns.relplot()for relational datasns.displot()for distribution datasns.catplot()for categorical data
Let’s now dive into how to use these functions to add rows and columns of small multiples to Seaborn.
Adding Columns of Visualizations to a Plot in Seaborn
Adding columns of subplots to a figure-level visualization in Seaborn can be done using the col= parameter. For example, if we wanted to add small multiples to the columns of a scatterplot, we could use the following code:
# Adding Columns of Subplots in Seaborn
import seaborn as sns
import matplotlib.pyplot as plt
df = sns.load_dataset('penguins')

sns.relplot(data=df, x='bill_length_mm', y='bill_depth_mm', col='island')
plt.show()
This returns the following image, where the variable passed into the col= parameter is split into multiple subplots:
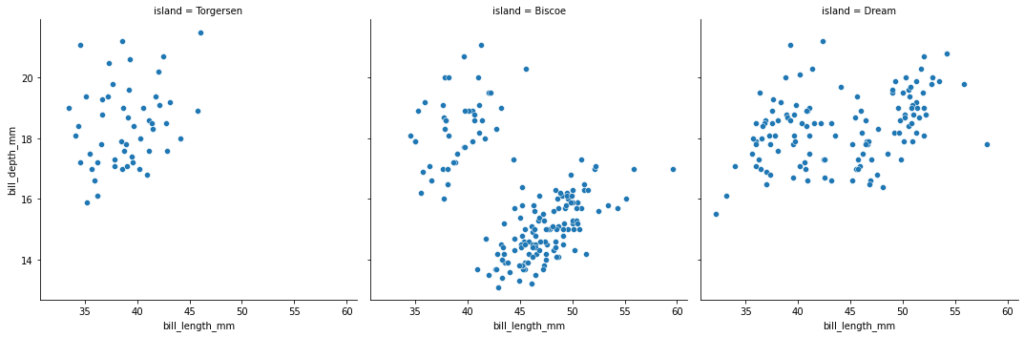
In the following section, you’ll learn how to also add rows of subplots.
Adding Rows of Visualizations to a Plot in Seaborn
Adding rows of subplots to a figure-level visualization in Seaborn can be done using the row= parameter. For example, if we wanted to add small multiples to the rows of a scatterplot, we could use the following code:
# Adding Rows of Subplots to a Seaborn Plot
import seaborn as sns
import matplotlib.pyplot as plt
df = sns.load_dataset('penguins')

sns.relplot(data=df, x='bill_length_mm', y='bill_depth_mm', row='sex', col='island')
plt.show()
This returns the following image, where we have added rows of subplots as well. We have combined the col= and row= parameters to create a grid of subplots.
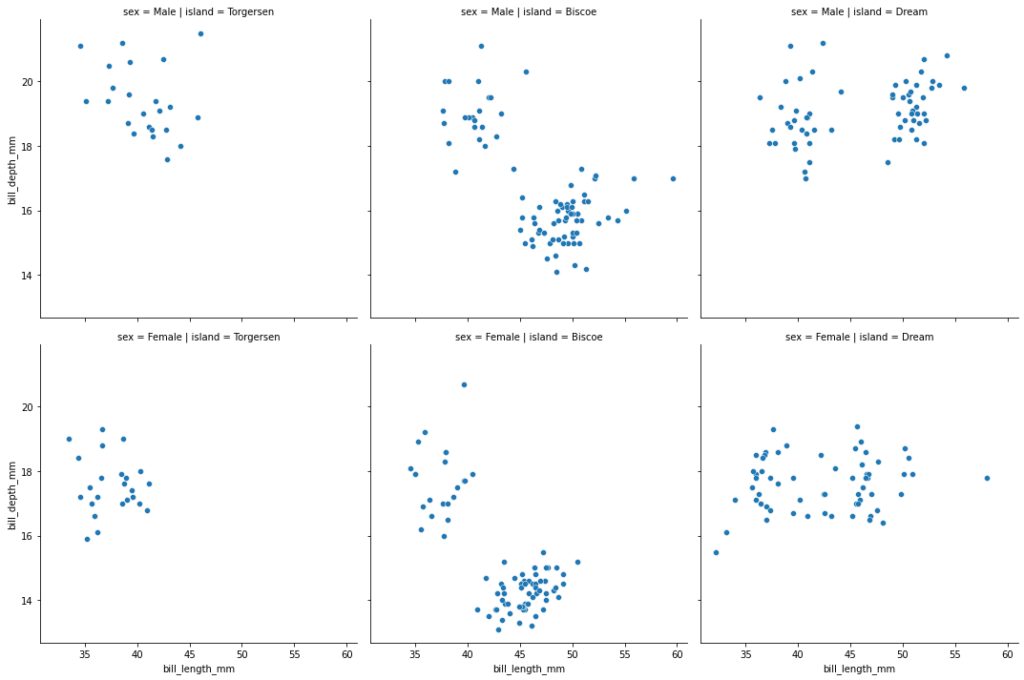
In the next section, you’ll learn how to add another variable of data by splitting data using color.
Adding Color to Visualizations of a Plot in Seaborn
In addition to splitting data into rows and columns of subplots, we can also add color to add another dimension.
# Adding Additional Data with the Hue Parameter
import seaborn as sns
import matplotlib.pyplot as plt
df = sns.load_dataset('penguins')

sns.relplot(data=df, x='bill_length_mm', y='bill_depth_mm', row='sex', col='island', hue='species')
plt.show()
When we use this code, we return the visualization below, where we have added an additional variable using color.
Now that you’ve walked through some practical examples, let’s dive into how the Seaborn FacetGrid works.
Understanding Seaborn FacetGrid to Create Subplots
The Seaborn FacetGrid allows you to place multiple plots onto a single plot. It’s actually the object type that gets returned when you generated figure-level visualizations, such as when you use relplot().
However, you can also create your own FacetGrid by creating one directly. Let’s see what this looks like in Python:
# Creating an Empty FacetGrid
import seaborn as sns
import matplotlib.pyplot as plt
df = sns.load_dataset('penguins')

grid = sns.FacetGrid(data=df, col='island')
In the example above, we created a FacetGrid, grid, by passing in the the DataFrame df into the data= parameter and the column of 'island' into the col= parameter.

Because our dataset has three unique values in the column 'island', three empty plots are created. We can pass in data by using the .map() method, which lets you pass in a function to map as well as additional parameters.
For example, if we pass in the sns.scatterplot function, we need to pass in at least two additional parameters: one for the x-axis and one for the y-axis. Let’s see what this looks like:
# Adding Data to a FacetGrid Mapping
import seaborn as sns
import matplotlib.pyplot as plt
df = sns.load_dataset('penguins')

grid = sns.FacetGrid(data=df, col='island')
grid.map(sns.scatterplot, 'bill_depth_mm', 'bill_length_mm')
plt.show()
By passing in these additional mappings, we’re able to create the same plot that we could have created by using: sns.relplot(data=df, x='bill_depth_mm', y='bill_length_mm', col='island'). The code we used is more explicit, though the second code is much easier to write (and, arguably, easier to understand).
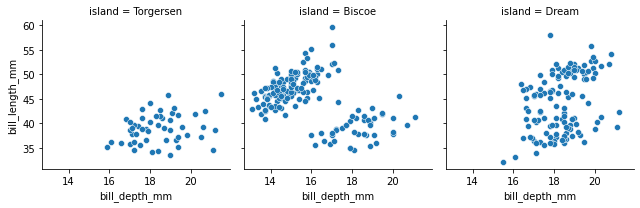
The graph above shows a FacetGrid created by passing in our DataFrame, split across the island column.
Conclusion
In this tutorial, you learned how to use Seaborn to create subplots in a small multiples method. By using Seaborn’s FacetGrid, you can split your plots into rows and columns, split across multiple variables.
You first learned how to use figure-level functions in Seaborn to create implicit FacetGrids. These can be used with the row= and col= parameters to pass in additional variables to split data. From there, you learned how to create FacetGrids from scratch and map in functions and data to visualize data.
Additional Resources
To learn more about related topics, check out the resources below: