Seaborn spines are the borders around a plot that help frame the data visualization. Seaborn makes it simple to customize and remove the spines of a visualization using the sns.despine() function. In this tutorial, you’ll learn how to use the Seaborn despine function to customize and remove spines from a visualization.
By the end of this tutorial, you’ll have learned the following:
- How to remove borders from a Seaborn plot using the sns.despine() function
- How to trim the borders of a data visualization in Seaborn
- How to set an offset for the spines of a Seaborn plot
Table of Contents
Understanding the Seaborn despine Function
The Seaborn despine() function is used to remove different borders from a Seaborn plot. The function allows you to, by default, remove the right and top border of a plot. However, you can go beyond that to remove all borders and customize how the borders are presented.
Let’s take a look a look at the Seaborn despine() function:
# Understanding the Seaborn despine Function
seaborn.despine(fig=None, ax=None, top=True, right=True, left=False, bottom=False, offset=None, trim=False)
Let’s break down the important parameters:
fig=andax=refer to the future and axes, respectively. If there is only one figure and one axes object, these are impliedtop=,right=,left=, andright=refer to which spines to remove. The parameters accept boolean arguments. By default, the top and right spines are removed.offset=customizes the amount by which spines are moved from the data.trim=identifies whether spines should be limited to the smallest and largest major tick on each non-despined axis
Let’s see how we can use the function to remove spines from a Seaborn plot.
How to Remove Spines From a Seaborn Plot with despine
In order to remove spines from a Seaborn plot using the sns.despine() function, we can control each of the four spines. Let’s load a sample graph first, to see how we can customize the plot. Let’s run the code below to create our sample visualization.
# A Seaborn Plot with Default Spines
import seaborn as sns
import matplotlib.pyplot as plt
df = sns.load_dataset('tips')
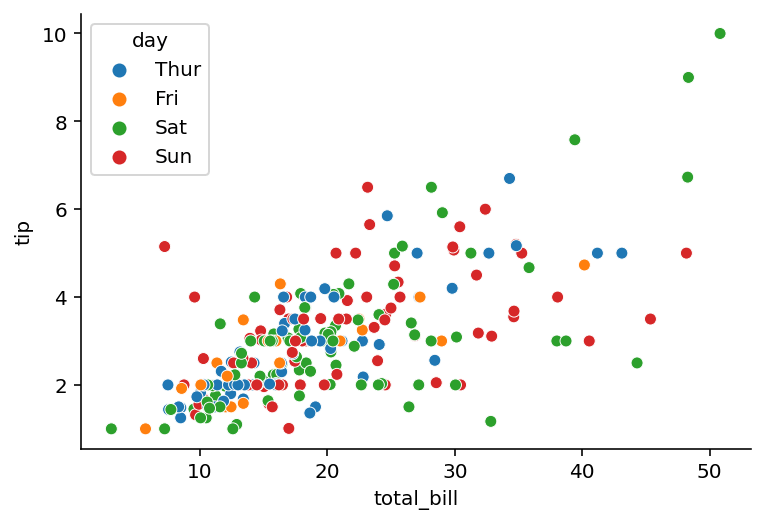
sns.scatterplot(data=df, x='total_bill', y='tip', hue='day')
plt.show()This returns the following image:

In the following section, you’ll learn how to remove the spines from a Seaborn plot.
How to Remove Default Spines from a Seaborn Plot
By default, the Seaborn despine function will remove the right and top borders from a data visualization. This means that we simply need to call the function in order to remove the right and top spines. Let’s see what this looks like in Python:
# A Seaborn Plot with Spines Removed
import seaborn as sns
import matplotlib.pyplot as plt
df = sns.load_dataset('tips')

sns.scatterplot(data=df, x='total_bill', y='tip', hue='day')
sns.despine()
plt.show()
By writing simply calling the sns.despine() function, we were able to remove the right and top borders, as shown below:
In the following section, you’ll learn how to also remove the x-axis from a plot in Seaborn.
How to Remove x-axis from a Seaborn Plot
In some cases, such as when working with categorical data, it may also be helpful to remove the x-axis. This can make your visualization much cleaner. In order to do this, we simply need to pass in bottom=False into the sns.despine() function.
# A Seaborn Plot with Only Bottom Spine Removed
ax = sns.violinplot(data=df, x='day', y='tip')
sns.despine(bottom=True)
ax.tick_params(bottom=False)
plt.show()
When we call the function, this returns the following visualization. Note that we also called the ax.tick_params() method to remove the bottom tick marks.
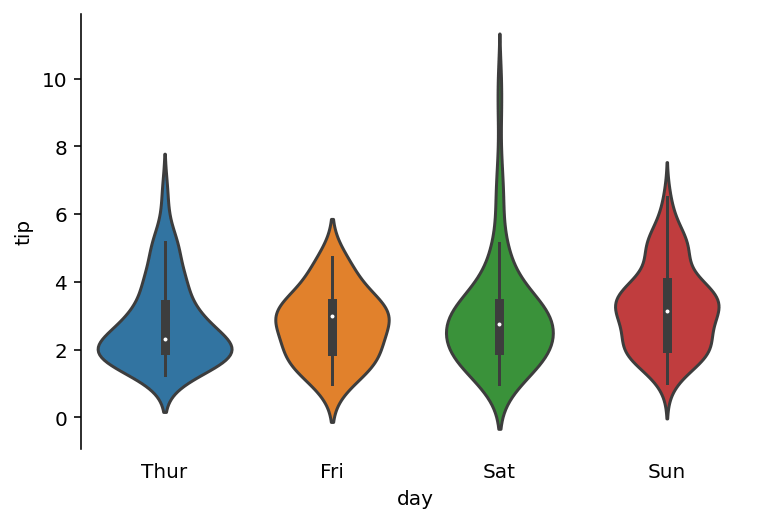
We can see that this makes the visual a little cleaner. In the following section, you’ll learn how to extend this further to remove all borders from a Seaborn plot.
How to Remove All Borders from a Seaborn Plot
In order to remove all borders from a Seaborn plot, you can pass in left=True and bottom=True into the Seaborn despine function. Because the right and top borders are removed by default when using the Seaborn despine function, you don’t need to specify these.
# A Seaborn Plot with All Spines Removed
import seaborn as sns
import matplotlib.pyplot as plt
df = sns.load_dataset('tips')
sns.scatterplot(data=df, x='total_bill', y='tip', hue='day')
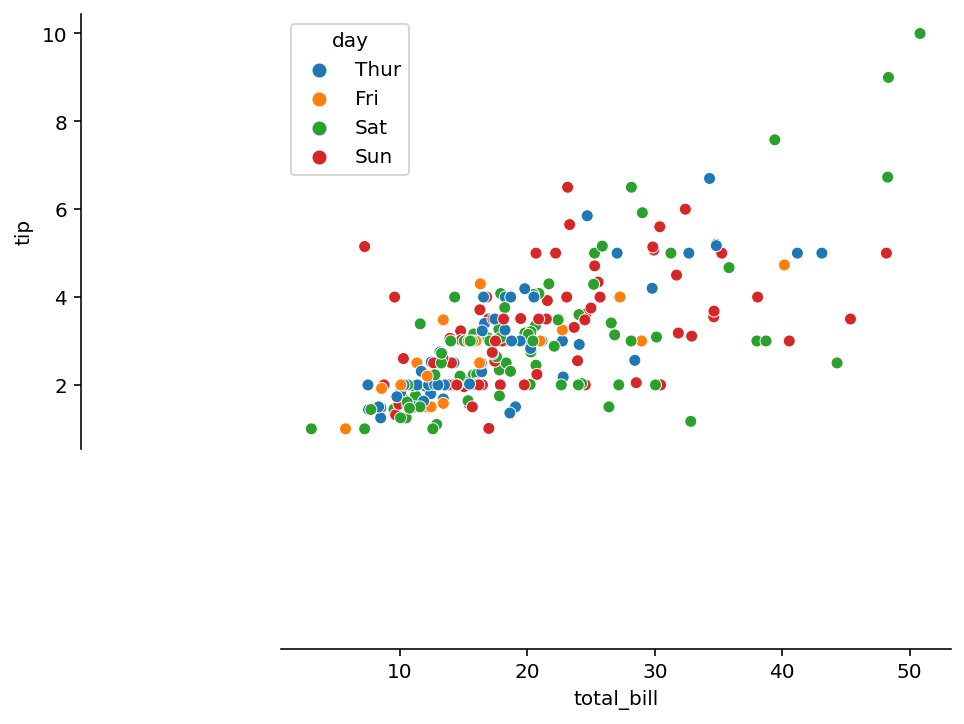
sns.despine(left=True, bottom=True)
plt.show()We can see that by using the code above, that all of the borders are removed and the following visualization is returned:

In the following section, you’ll learn how to customize spines further by trimming them.
How to Trim the Spines of a Seaborn Plot
Seaborn also allows you to trim the spines of a plot. This means that the values are stretched only from the first data point to the last, but not beyond them. In order to do this, we can pass in trim=True into the sns.despine() function. Let’s see what this looks like:
# A Seaborn Plot with Spines Removed
import seaborn as sns
import matplotlib.pyplot as plt
df = sns.load_dataset('tips')

sns.scatterplot(data=df, x='total_bill', y='tip', hue='day')
sns.despine(trim=True)
plt.show()
By running the code block above, we trim the spines of the visualization in Seaborn. In this case, the spine only goes from 2 to 10 on the y-axis and from 10 to 50 on the x-axis.

In the final section below, you’ll learn how to offset the the border of a Seaborn plot.
How to Offset the Border of a Seaborn Plot
Seaborn also allows you to offset the spines of a plot, which can be very helpful for scientific visualizations. This allows you to maintain the axes but move them further from the data points. In order to do this, we can use the offset= parameter, which allows you to pass in an integer.
# A Seaborn Plot with Spine Offset
import seaborn as sns
import matplotlib.pyplot as plt
df = sns.load_dataset('tips')

sns.scatterplot(data=df, x='total_bill', y='tip', hue='day')
sns.despine(offset=100)
plt.show()
In the code block above, we passed in 100 into the offset parameter. This moves the spines 100 points away. In this case, we moved all the remaining spines. If we wanted to offset only a single axis, you can pass in a dictionary of offsets.
In the example above, we offset our spines by 100 points.
Conclusion
In this tutorial, you learned how to use the Seaborn despine() function to remove spines from a Seaborn plot. This allows you to remove the borders from a graph. You first learned how the despine function is defined and what the parameters are.
From there, you learned how to remove spines using the despine function. By default, the function removes the top and right borders. You learned how to remove additional borders by passing in additional arguments. From there, you learned how to use the function to trim the spines of a chart. Finally, you learned how to offset borders in a Seaborn graph.
Additional Resources
To learn more about related topics, check out the tutorials below: