In this guide, you’ll learn how to use the Seaborn rugfplot() function to plot distributions in the margins to visualize the distribution of a dataset. Rug plots are valuable tools to visualize how datasets are distributed, allowing you to gain strong insight into your data. In this tutorial, you’ll learn about the different parameters and options of the Seaborn rugplot function.
By the end of this tutorial, you’ll have learned the following:
- How the Seaborn
rugplot()function works - How to customize your Seaborn rugplots using line widths and transparency
- How to add Seaborn rugplots to other plots
Table of Contents
Understanding the Seaborn rugplot Function
Before diving into creating rugplots in Seaborn, let’s explore the parameters and default arguments of the Seaborn rugplot function:
# Understanding the rugplot() Function
seaborn.rugplot(data=None, *, x=None, y=None, hue=None, height=0.025, expand_margins=True, palette=None, hue_order=None, hue_norm=None, legend=True, ax=None, **kwargs)
The function offers a large variety of parameters. While we won’t cover all of them in this tutorial, we’ll explore the most important ones, such as:
data=provides the data to plot via a Pandas DataFramex=andy=provide the variables to plot on the x- and y-axis respectivelyhue=adds an additional variable to plot via a color mapping
Let’s get started in creating some rug plots in Seaborn.
Creating a Seaborn Rugplot with rugplot
In order to create a simple rug plot, we can simply pass a Pandas DataFrame into the data= parameter and a column label into the x= or y= parameter. Let’s take a look at what this looks like:
# Creating a Rug Plot in Seaborn
import seaborn as sns
import matplotlib.pyplot as plt
df = sns.load_dataset('penguins')

sns.rugplot(data=df, x='body_mass_g')
plt.show()
In the example above, we imported our libraries – Seaborn as well as Matplotlib. We then loaded our dataset using the Seaborn load_dataset() function. Finally, we created a rug plot by passing in 'body_mass_g' into the x= parameter. This returns the plot below:
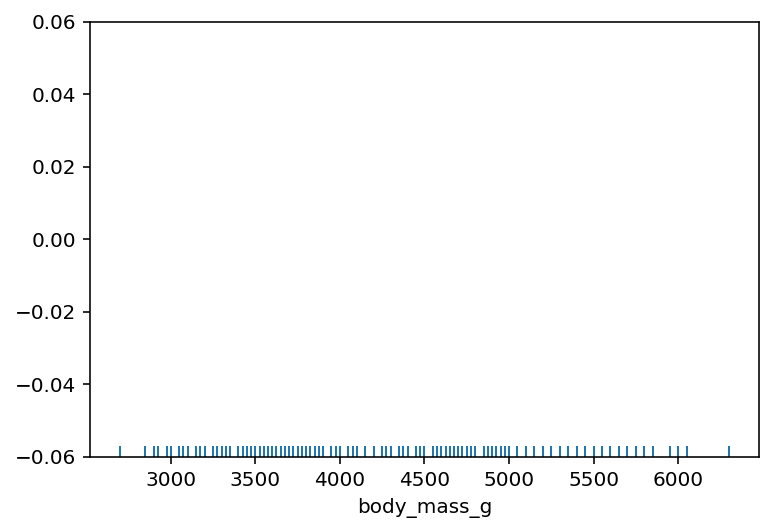
The rugplot shows how many data points fall at each part of the distribution. This allows you to better understand clustering at certain points of the dataset.
In the following section, you’ll learn how to combine a rug plot with another plot in Seaborn.
Combine a Seaborn rugplot with Another Plot
By itself, the Seaborn rugplot show quite a lot of detail, but don’t seem as useful as other distribution plots like KDE plots and histograms. The power of the rug plot comes to shine when it’s combined with another plot.
In order to combine a Seaborn rugplot with another plot, you can simply layer the axes-level functions on top of one another. Let’s see how we can do this by combining it with a scatter plot.
# Combining a Rug Plot in Seaborn
import seaborn as sns
import matplotlib.pyplot as plt
df = sns.load_dataset('penguins')
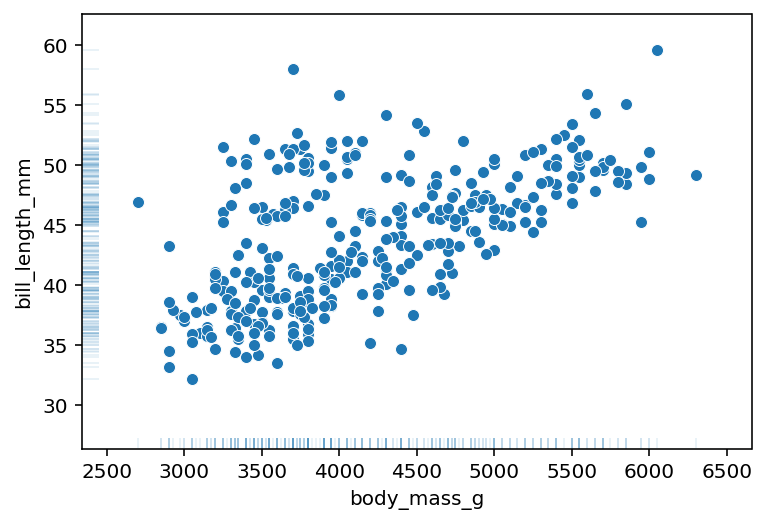
sns.scatterplot(data=df, x='body_mass_g', y='bill_length_mm')
sns.rugplot(data=df, x='body_mass_g', y='bill_length_mm')
plt.show()In the code block above, we first called the Seaborn scatterplot function and then call the rugplot function afterward. This returns the data visualization below:
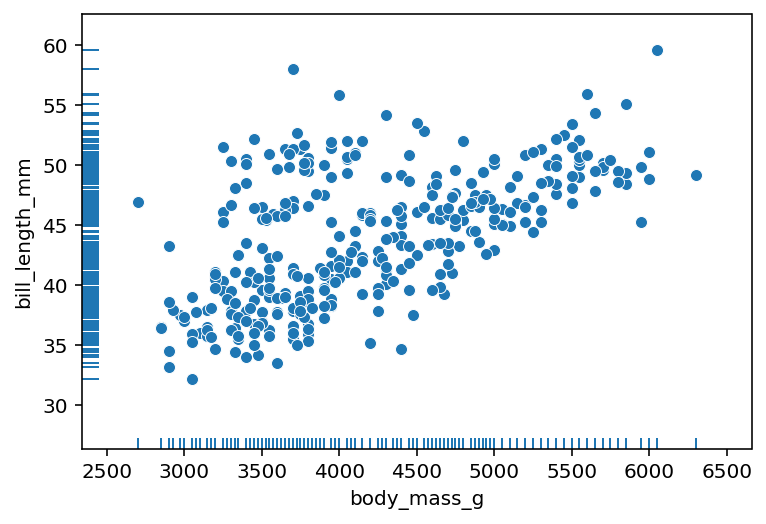
By combining the rug plot with a scatterplot, we can see how the distribution changes at different parts of the dataset.
Adding Additional Categories to Seaborn Rugplots with Hue
As with other Seaborn plots, we can customize how the rugplots are displayed by adding a color semantic using the hue= parameter. This can allow you to see how different parts of the dataset are distributed. Let’s see how we can add the hue semantic to our Seaborn rugplot.
# Adding Color to a Rug Plot in Seaborn
import seaborn as sns
import matplotlib.pyplot as plt
df = sns.load_dataset('penguins')

sns.scatterplot(data=df, x='body_mass_g', y='bill_length_mm', hue='sex')
sns.rugplot(data=df, x='body_mass_g', y='bill_length_mm', hue='sex')
plt.show()
In the code block above, we added the hue= parameter to each of our function calls. This colors both the rugplot and the secondary plot to each category in the plot.
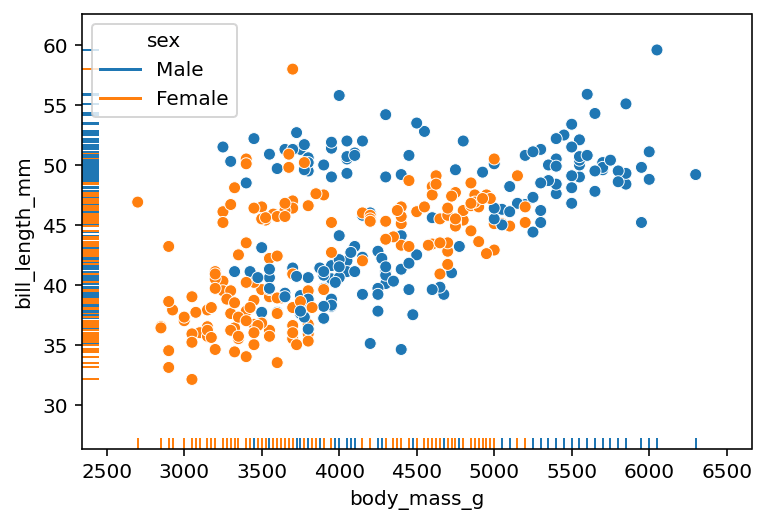
With this customization, it’s important to not add too many color elements. Because the rug plot is quite condensed, adding too many color points would make the visualization more difficult to understand.
Change Line Widths and Alpha in Seaborn Rugplots
When working with datasets that have many points, the details of the rugplot are lost. In order to resolve this, we can use the alpha= and lw= parameters. These parameters control the transparency and the line width of the individual bars in a Seaborn rugplot.
# Change Line Widths and Alpha in Seaborn Rugplots
import seaborn as sns
import matplotlib.pyplot as plt
df = sns.load_dataset('penguins')

sns.scatterplot(data=df, x='body_mass_g', y='bill_length_mm')
sns.rugplot(data=df, x='body_mass_g', y='bill_length_mm', alpha=0.1, lw=10)
plt.show()
In the code block above, we set the alpha to 0.1 and the line width to 10. This returns the visualization below:
We can see how this can make our rugplot much easier to understand. As the volume of your dataset grows, playing around with the settings can make your plot much easier to understand.
Conclusion
In this guide, you learned how to use the Seaborn rugplot() function to create informative rugplots in Seaborn that can be combined with other plots. Rug plots allow you to get a strong understanding of the distribution of data.
You first learned what the Seaborn rugplot function offers in terms of parameters and default arguments. Then, you learned how to create simple rugplots. From there, you built on what you learned to add rugplots to other Seaborn visualizations. Then, you learned how to add a color semantic for additional detail, as well as how to modify the transparency of lines when data volumes are large.
Additional Resources
To learn more about related topics, check out the resources below: