Learn Python. In just 30 days.
30 days of hands-on lessons to take you from beginner to building machine learning models.
Whether you’ve been wanting to learn Python to advance your career, pick up a new skill, or get that raise, this is the course for you. In just 30 days, you’ll have gone from not writing a single line of code to completing your first machine-learning project!
Best of all: it’s free.

Days 1-9: Introduction to Python
Day 1: Introduction to Python Programming
Learn what Python is and dive into writing your first lines of code, right in your browser! Go to Day 1.
Day 2: Python Functions
Learn how to use functions in Python to make your code more dynamic and powerful! Go to Day 2.
Day 3: Installing Python
It’s time to install Python! By doing this, you’ll be able to write and run more complex scripts. Go to Day 3.
Day 4: Conditionals and Booleans
Learn how to control the flow of your Python programs using conditions, working with booleans, and comparisons. Go to Day 4.
Day 5: Python For Loops and Iteration
Learn how to prevent needing to write the same lines of code over and over again by using the magic of Python for loops. Go to Day 5.
Day 6: Python Lists
Learn how to store data in one of the fundamental data structures in Python, the Python list. Go to Day 6.
Day 7: Python Dictionaries
Sometimes Python lists just aren’t enough. Learn how dictionaries allow you to build relational data structures to simplify retrieving data. Go to Day 7.

Day 8: Python Tuples
Learn how to use Python tuples to store data in ways that can’t be changed. You’ll learn how tuples make your code more efficient. Go to Day 8.
Day 9: Object-Oriented Programming
Learning object-oriented programming can seem daunting. This tutorial makes it easy. Learn how to use OOP in the realm of data science! Go to Day 9.
Days 10-23: Data Analysis with Pandas
Day 10: Working with External Libraries
Python’s extensive libraries make it incredibly powerful. Learn how to install, import, and use external libraries to extend your arsenal of tools. Go to Day 10.
Day 11: NumPy for Data Science in Python
NumPy is a cornerstone of working with data in Python. Learn how NumPy’s array data structure is a hugely powerful tool to learn in data science. Go to Day 11.
Day 12: Introduction to Pandas
Pandas builds provides access to tabular data in a familiar and easy-to-use package. Learn the basics of Pandas to load and analyze data. Go to Day 12.
Day 13: Indexing, Selecting, and Assigning Data
Learn how to index, select and assign data in a Pandas DataFrame. Mastering this foundational skill will make any future work significantly easier. Go to Day 13.
Day 14: Counting Values in Pandas with value_counts
Learn how to count unique values in a Pandas DataFrame, including determining the percentages each value makes up. Go to Day 14.
Day 15: Summarizing and Analyzing a Pandas DataFrame
Exploratory data analysis is a key step in any data science project. This tutorial builds on what you have learned to explore datasets. Go to Day 15.
Day 16: How to Sort Data in a Pandas DataFrame
Sorting your data can give you insight into your data and makes the presentation of your analysis much more powerful. Go to Day 16.

Day 17: Binning Data in Pandas with cut and qcut
Binning continuous data into discrete categories allows you to better understand the distributions of your data. Go to Day 17.
Day 18: Transforming Pandas Columns with map and apply
Learn how to apply advanced transformations with built-in and custom functions to your Pandas DataFrame. Go to Day 18.
Day 19: Group and Aggregate Data
Learn how to use the Pandas group by method to easily and quickly aggregate your data. Go to Day 19.
Day 20: Combine Data with merge and concat
Learn how to merge and combine datasets from different sources in meaningful ways. Go to Day 20.
Day 21: Pivot Tables in Pandas with Python
Learn how to create pivot tables in Pandas to easily summarize your data, including with custom functions. Go to Day 21.
Day 22: Data Cleaning and Preparation
Learn how to clean your data with a hands-on tutorial, showing you how to take on common cleaning tasks. Go to Day 22.
Day 23: DateTime in Pandas and Python
Pandas makes working with dates and times easy! Learn how to gain time-series insights and aggregate data in new ways. Go to Day 23.
Days 24-25: Visualize Data with Python

Day 24: Plotting in Python with Matplotlib
Learn how to use one of the fundamental and most important data visualization libraries, Matplotlib. Go to Day 24.
Day 25: Seaborn for Data Visualization
Seaborn builds on Matplotlib – learn how to use the library to easily create beautiful, statistical visualizations. Go to Day 25.
Days 26-30: Dive into Machine Learning
Day 26: Introduction to Machine Learning in Python
Learn what machine learning is and how it’s shaping the world around you, including what supervised and unsupervised machine learning are. Go to Day 26.
Day 27: Introduction to Scikit-Learn (sklearn) in Python
Explore one of the fundamental Python libraries for machine learning: Scikit-Learn. You’ll learn how to build your first algorithm, a classifier. Go to Day 27.
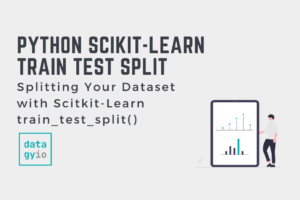
Day 28: Splitting Your Dataset with Scitkit-Learn train_test_split
Learning how to split your data into training and testing data is critical to the success of your models, by giving you an opportunity to evaluate them. Go to Day 28.
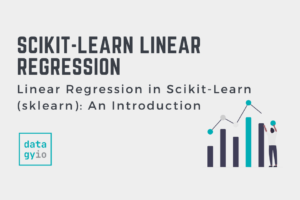
Day 29: Linear Regression in Scikit-Learn
Learn how how to use linear regression to make predictions. Follow a hands-on project to predict insurance costs using a detailed dataset. Go to Day 29.
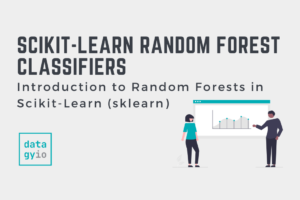
Day 30: Introduction to Random Forests in Scikit-Learn
Random forests can prevent you from overfitting your model. Using a hands-on project, learn how to classify the species of penguins. Go to Day 30.