In this tutorial, you’ll learn how to learn the fundamentals of linear regression in Scikit-Learn. Throughout this tutorial, you’ll use an insurance dataset to predict the insurance charges that a client will accumulate, based on a number of different factors. You’ll learn how to model linear relationships between a single independent and dependent variable and multiple independent variables and a single dependent variable.
By the end of this tutorial, you’ll have learned:
- Why linear regression can be a powerful predictor in machine learning
- How to use Scikit-Learn to model a linear relationship
- How to develop a multivariate linear regression model
- How to evaluate the effectiveness of your model
Table of Contents
What is Linear Regression
Linear regression is a simple and common type of predictive analysis. Linear regression attempts to model the relationship between two (or more) variables by fitting a straight line to the data. Put simply, linear regression attempts to predict the value of one variable, based on the value of another (or multiple other variables).
You may recall from high-school math that the equation for a linear relationship is: y = m(x) + b. In machine learning, m is often referred to as the weight of a relationship and b is referred to as the bias.
This relationship is referred to as a univariate linear regression because there is only a single independent variable. In many cases, our models won’t actually be able to be predicted by a single independent variable. In these cases, there will be multiple independent variables influencing the dependent variable. This can often be modeled as shown below:
y = m1x1 + b1 + m2x2 + b2 + ...
Where the weight and bias of each independent variable influence the resulting dependent variable.
In the image below, you can see the line of best fit being applied to some data. The more linear a relationship, the more accurately the line of best fit will describe a relationship.

Let’s get started with learning how to implement linear regression in Python using Scikit-Learn!
Loading a Sample Dataset
The dataset that you’ll be using to implement your first linear regression model in Python is a well-known insurance dataset. You can find the dataset on the datagy Github page.
To explore the data, let’s load the dataset as a Pandas DataFrame and print out the first five rows using the .head() method.
import pandas as pd
df = pd.read_csv('https://raw.githubusercontent.com/datagy/data/main/insurance.csv')
print(df.head())

# Returns:
#    age     sex     bmi  children smoker     region      charges
# 0   19  female  27.900         0    yes  southwest  16884.92400
# 1   18    male  33.770         1     no  southeast   1725.55230
# 2   28    male  33.000         3     no  southeast   4449.46200
# 3   33    male  22.705         0     no  northwest  21984.47061
# 4   32    male  28.880         0     no  northwest   3866.85520
By printing out the first five rows of the dataset, you can see that the dataset has seven columns:
age– covering the age of the clientsex– the sex of the clientbmi– the body mass index of the clientchildren– the number of children the client hassmoker– whether the client smokes or notregion– the region that the client lives incharges– the total charges paid by the client
For this tutorial, you’ll be exploring the relationship between the first six variables and the charges variable. Specifically, you’ll learn how to explore how the numeric variables from the features impact the charges made by a client.
You’ll notice I specified numeric variables here. This is because regression can only be completed on numeric variables. While there are ways to convert categorical data to work with numeric variables, that’s outside the scope of this tutorial.
Before going any further, let’s dive into the dataset a little further. Let’s confirm that the numeric features are in fact stored as numeric data types and whether or not any missing data exists in the dataset. This can be done by applying the .info() method:
# Exploring the dataset
print(df.info())

# Returns:
# <class 'pandas.core.frame.DataFrame'>
# RangeIndex: 1338 entries, 0 to 1337
# Data columns (total 7 columns):
#  #   Column    Non-Null Count  Dtype
# ---  ------    --------------  -----
#  0   age       1338 non-null   int64
#  1   sex       1338 non-null   object
#  2   bmi       1338 non-null   float64
#  3   children  1338 non-null   int64
#  4   smoker    1338 non-null   object
#  5   region    1338 non-null   object
#  6   charges   1338 non-null   float64
# dtypes: float64(2), int64(2), object(3)
# memory usage: 73.3+ KB
# None
From this, you can see that the age, bmi, and children features are numeric, and that the charges target variable is also numeric.
Exploring Correlation Using Pandas
One way that we can identify the strength of a relationship is to use the coefficient of correlation. What is a Correlation Coefficient? A coefficient of correlation is a value between -1 and +1 that denotes both the strength and directionality of a relationship between two variables. The closer the value is to 1 (or -1), the stronger a relationship. The closer a number is to 0, the weaker the relationship. A negative coefficient will tell us that the relationship is negative, meaning that as one value increases, the other decreases. Similarly, a positive coefficient indicates that as one value increases, as does the other.
Pandas makes it very easy to calculate the coefficient of correlation between all numeric variables in a dataset using the .corr() method. Let’s apply the method to the DataFrame and see what it returns:
print(df.corr(numeric_only=True))

# Returns:
#                age       bmi  children   charges
# age       1.000000  0.109272  0.042469  0.299008
# bmi       0.109272  1.000000  0.012759  0.198341
# children  0.042469  0.012759  1.000000  0.067998
# charges   0.299008  0.198341  0.067998  1.000000
From this, you can see that the strongest relationship exists between the age and charges variable. It’s still a fairly weak relationship. Let’s see what other insights we can get from the data.
Plotting a Pairwise Plot of the Data
A pairwise plot shows the relationship between pairs of variables. The plot shows a scatterplot of each pair of variables, allowing you to see the nuances of the distribution that simply looking at the correlation may not actually indicate. Let’s import seaborn and plot a pairwise plot using the .pairplot() function.
# Creating a pairwise plot in Seaborn
import seaborn as sns
import matplotlib.pyplot as plt
sns.pairplot(df)
plt.show()
This returns the following image:
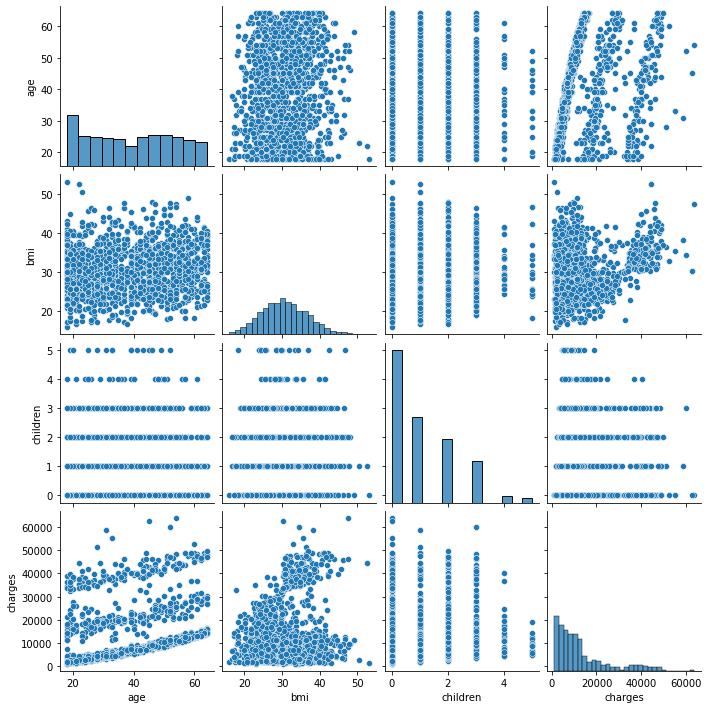
pairplot()It looks like the data is fairly all over the place and those linear relationships may be harder to identify. However, if you look closely, you can see some level of stratification. For example, the pairplots for charges and age as well as charges and BMI show separate clusters of data.
Let’s see how we can apply some of the other categorical data to see if we can identify any nuances in the data. Because the smoker variable is a binary variable (either “yes” or “no”), let’s split the data by that variable. This can be done by passing in the hue= parameter.
# Plotting a pairplot of your DataFrame
sns.pairplot(df, hue='smoker')
plt.show()
This returns the following image:

From this, you can see that there are clear differences in the charges of clients that smoke or don’t smoke. Let’s take a closer look at the relationship between the age and charges variables. This can be done using the relplot() function in Seaborn.
# Plotting a scatterplot of the relationship of age and charges
sns.relplot(data=df, x='age', y='charges', hue='smoker')
plt.show()
This returns the following image:

This is great! Aside from a few outliers, there’s a clear, linear-looking, trend between the age and charges for non-smokers. Remember, when you first calculated the correlation between age and charges was the strongest, but it was still a weak relationship. Now that you know that smoking is a strong determinant in charges, let’s filter the DataFrame to only non-smokers and see if this makes a difference in correlation.
non_smokers = df[df['smoker'] == 'no']
print(non_smokers.corr(numeric_only=True))

# Returns:
#                age       bmi  children   charges
# age       1.000000  0.122638  0.033395  0.627947
# bmi       0.122638  1.000000  0.019208  0.084037
# children  0.033395  0.019208  1.000000  0.138929
# charges   0.627947  0.084037  0.138929  1.000000
The correlation between age and charges increased from 0.28 to 0.62 when filtering to only non-smokers. Let’s focus on non-smokers for the rest of the tutorial, since we’re more likely to be able to find strong, linear relationships for them.
Building a Linear Regression Model Using Scikit-Learn
Let’s now start looking at how you can build your first linear regression model using Scikit-Learn. When you build a linear regression model, you are making the assumption that one variable has a linear relationship with another. This means that the model can be interpreted using a straight line.
But how do we know what the line looks like? This is where linear regression comes into play! Using linear regression, you can find the line of best fit, i.e., the line that best represents the data.
What linear regression does is minimize the error of the line from the actual data points using a process of ordinary least squares. In this process, the line that produces the minimum distance from the true data points is the line of best fit.
Let’s begin by importing the LinearRegression class from Scikit-Learn’s linear_model. You can then instantiate a new LinearRegression object. In this case, it’s been called model.
# Instantiating a LinearRegression Model
from sklearn.linear_model import LinearRegression
model = LinearRegression()
This object also has a number of methods. One of these is the fit() method, which is used to fit data to a linear model. Let’s see how can learn a little bit about this method, by calling the help() function on it:
# Getting help on the .fit() method
help(model.fit)

# Returns:
# Help on method fit in module sklearn.linear_model._base:

# fit(X, y, sample_weight=None) method of sklearn.linear_model._base.LinearRegression instance
#     Fit linear model.

#     Parameters
#     ----------
#     X : {array-like, sparse matrix} of shape (n_samples, n_features)
#         Training data.

#     y : array-like of shape (n_samples,) or (n_samples, n_targets)
#         Target values. Will be cast to X's dtype if necessary.

#     sample_weight : array-like of shape (n_samples,), default=None
#         Individual weights for each sample.

#         .. versionadded:: 0.17
#            parameter *sample_weight* support to LinearRegression.

#     Returns
#     -------
#     self : object
#         Fitted Estimator.
From the help documentation, you can see that the method expects two arrays: X and y. X is expected to be a two-dimensional array (as denoted by the capital X), while y is expected to be one-dimensional.
As with other machine-learning models, X will be the features of the dataset, while y will be the target of the dataset. In this case, we’ll start off by only looking at a single feature: age. Let’s convert age to a DataFrame and parse out charges into a Series.
# Creating two arrays for the feature and target
X = non_smokers[['age']]
y = non_smokers['charges']
In the code above, you used double square brackets to return a DataFrame for the variable X. We can confirm the types by using the type() function:
# Checking the type of our arrays
print('The type of X is ', type(X))
print('The type of y is ', type(y))

# Returns:
# The type of X is  <class 'pandas.core.frame.DataFrame'>
# The type of y is  <class 'pandas.core.series.Series'>
Now that we know that X is two-dimensional and y is one-dimensional, we can create our training and testing datasets.
# Splitting the datasets into training and testing
from sklearn.model_selection import train_test_split
X_train, X_test, y_train, y_test = train_test_split(X, y, shuffle=True, train_size=0.3)
Now that our datasets are split, we can use the .fit() method to fit our data. Let’s pass these variables in to create a fitted model. We’ll use the training datasets to create our fitted model.
# Fitting our model
model.fit(X_train, y_train)
Now that our model has been fitted, we can use our testing data to see how accurate the data is. Because in the case of regression, our labels are continuous, we can use a number of different metrics. The table below breaks down a few of these:
| Metric Type | Range | Description / Interpretation |
|---|---|---|
| R squared | 0-1 (larger is better) | The proportion of the variance in the predicted variable (y) that can be explained by the features (X) |
| Root mean squared error (RMSE) | 0+ (lower is better) | A representation of the average distance between the observed data values and the predicted data values |
Scikit-learn comes with all of these evaluation metrics built-in. We can import them from the metrics module. Let’s load them, predict our values based on the testing variables, and evaluate the effectiveness of our model.
# Running Evaluation Metrics
from sklearn.metrics import mean_squared_error, r2_score
predictions = model.predict(X_test)
r2 = r2_score(y_test, predictions)
rmse = mean_squared_error(y_test, predictions, squared=False)

print('The r2 is: ', r2)
print('The rmse is: ', rmse)

# Returns:
# The r2 is:  0.37371317540937177
# The rmse is:  4706.59088022
These results aren’t ideal. The r2 value is less than 0.4, meaning that our line of best fit doesn’t really do a good job of predicting the charges. However, based on what we saw in the data, there are a number of outliers in the dataset. Because the r2 value is affected by outliers, this could cause some of the errors to occur.
Let’s see if we can improve our model by including more variables into the mix.
Multivariate Linear Regression in Scikit-Learn
In this section, you’ll learn how to conduct linear regression using multiple variables. In this case, rather than plotting a line, you’re plotting a plane in multiple dimensions. However, the phenomenon is still referred to as linear since the data grows at a linear rate.
Scikit-Learn makes it very easy to create these models. Remember, when you first fitted your model, you passed in a two-dimensional array X_train. That array only had one column. However, you can simply pass in an array of multiple columns to fit your data to multiple variables. Let’s see how this is done:
# Creating new variables
X = non_smokers[['age', 'bmi']]
y = non_smokers['charges']

# Splitting the data into training and testing
X_train, X_test, y_train, y_test = train_test_split(X, y, shuffle=True, train_size=0.3)

# Creating a new model and fitting it
multi_model = LinearRegression()
multi_model.fit(X_train, y_train)

# Prediction new values
predictions = multi_model.predict(X_test)
r2 = r2_score(y_test, predictions)
rmse = mean_squared_error(y_test, predictions, squared=False)

print('The r2 is: ', r2)
print('The rmse is: ', rmse)

# Returns:
# The r2 is:  0.3711113278927346
# The rmse is:  4867.23495571
It looks like our results have actually become worse! Knowing that smoking has a large influence on the data, we can convert the smoker column into a numerical column. Since this is a binary question, we can convert the value of 'yes' to 1 and 'no' to 0. Following that, we can simply pass in the data and evaluate our model:
# Creating new variables
df['smoker_int'] = df['smoker'].map({'yes':1, 'no':0})
X = df[['age', 'bmi', 'smoker_int']]
y = df['charges']

# Splitting the data into training and testing
X_train, X_test, y_train, y_test = train_test_split(X, y, shuffle=True, train_size=0.3)

# Creating a new model and fitting it
multi_model = LinearRegression()
multi_model.fit(X_train, y_train)

# Prediction new values
predictions = multi_model.predict(X_test)
r2 = r2_score(y_test, predictions)
rmse = mean_squared_error(y_test, predictions)

print('The r2 is: ', r2)
print('The rmse is: ', rmse)

# Returns:
# The r2 is:  0.7455266762675961
# The rmse is:  6177.07010254
In this case, while our r2 value increases, as did our errors. Logically, this makes sense. We are now fitting the line on a dataset of a much larger spread. Because of this, the line may fit better, while the overall variance of the data varies too.
Tip: if you wanted to show the root mean squared error, you could pass the squared=False argument to the mean_squared_error() function. By default, the squared= parameter will be set to True, meaning that the mean squared error is returned.
If you’re satisfied with the data, you can actually turn the linear model into a function. With this function, you can then pass in new data points to make predictions about what a person’s charges may be. Let’s see how you can do this.
The model has two attributes:
.coef_which stores an array of the coefficients of our model.intercept_which stores the y-intercept of our linear model
The number of coefficients will match the number of features being passed in. Let’s see what they look like:
# Printing coefficients and intercept
print(multi_model.coef_)
print(multi_model.intercept_)

# Returns:
# [  238.47905621   370.5876659  23627.93402865]
# -12061.849365383008
We can easily turn this into a predictive function to return the predicted charges a person will incur based on their age, BMI, and whether or not they smoke. Let’s create this function now:
# Writing a function to predict charges
coefficients = multi_model.coef_
intercept = multi_model.intercept_
def calculate_charges(age, bmi, smoker):
  return (age * coefficients[0]) + (bmi * coefficients[1]) + (smoker * coefficients[2]) + intercept
Now, say we have a person who is 33, has a BMI of 22, and doesn’t smoke, we could simply pass in the following arguments:
# Predicting charges
print(calculate_charges(33, 22, 0))

# Returns: 3960.8881392049407
In the case above, the person would likely have just under $4,000 of charges!
Exercises
It’s time to check your learning. Try and complete the exercises below. If you need a hint or want to check your solution, simply toggle the question.
How would you include the sex variable in the regression analysis?
You could convert the values to 0 and 1, as they are represented by binary values.
Consider how you might include categorical variables like the region variable in the model.
Since these are not binary variables, you cannot encode them as 0 and 1. However, it probably does not make sense to encode them as 0, 1, 2, … This is because there is no intrinsic hierarchy in them. Read this article on one-hot encoding and see how you can build the region variable into the model.
Conclusion and Recap
In this tutorial, you explore how to take on linear regression in Python using Scikit-Learn. The section below provides a recap of what you learned:
- Linear regression involves fitting a line to data that best represents the relationship between a dependent and independent variable
- Linear regression assumes that the relationship is linear
- Similarly, multivariate linear regression can model the linear relationship between multiple independent variables and a dependent variable
- The Scikit-Learn library provides a LinearRegression class to fit and predict data
Additional Resources
To learn more about related topics, check out the tutorials below:
Pingback: How to Calculate Mean Squared Error in Python • datagy
Very very helpful and well explained steps. Thank you
Thank you so much, Tinotenda!
Excellent tutorial, thanks a lot.
Thanks so much, Jayron! I appreciate it!
Thanks for the tutorial! I found one edit. The last time you reference rmse you need to append squared=False. Otherwise you end up with a crazy big number (the mse). Thanks again — this helped me learn.
Thanks so much, Mary! I’ll make note of that in the tutorial :).
Thank you so much for this tutorial! This was exactly what I was looking for, a step-by-step guide through the code, always explaining what you’re doing and why.
Thanks so much Luise! I really appreciate it!
Oooo this lesson was kinda hard haha but very very good. Thanks Nik.
Thanks Chis!
Very useful tutorial, thank you so much!
Thanks Eric!
pandas version 2.0 and above, .corr() need to use ‘numeric_only=True’ to avoid error of “ValueError: could not convert string to float: ‘female'”
df.corr(numeric_only=True)
age bmi children charges
age 1.000000 0.109272 0.042469 0.299008
bmi 0.109272 1.000000 0.012759 0.198341
children 0.042469 0.012759 1.000000 0.067998
charges 0.299008 0.198341 0.067998 1.000000
Thanks so much, CF, for flagging that! I have updated the article.