In this post, you’ll learn how to perform t-tests in Python using the popular SciPy library. T-tests are used to test for statistical significance and can be hugely advantageous when working with smaller sample sizes.
By the end of this tutorial, you’ll have learned the following:
- What the different t-tests are and when they should be applied
- How to perform a one-sample t-test and a two-sample t-test in Python
- How to interpret the results from your statistical tests
Table of Contents
Understanding the T-Test
The t-test, or often referred to as the student’s t-test, dates back to the early 20th century. An Irish statistician working for Guinness Brewery, William Sealy Gosset, introduced the concept. Because the brewery was working with small sample sizes and was under strict orders of confidentiality, Gosset published his findings under the pseudonym “Student”. His seminal work, “The Probable Error of a Mean,” laid the groundwork for what we now know as Student’s t-test.
This leads us to one of the primary benefits of the t-test: the t-test is able to make reliable inferences about a population using a small sample size. Let’s explore how this works by discussing the theory behind the t-test in the following section.
Understanding the Student’s T-Test
Statistical tests are used to make assumptions about some population parameters. For example, it lets us test whether or not the average test score for any given group of students is 70%. The T-Test works in two different ways:
- The one-sample t-test allows us to test whether or not the population mean is equal to some value
- The two-sample t-test allows us to test whether or not two population means are equal
Let’s explore these in a little more depth.
Understanding the One-Sample T-Test
The one-sample t-test is used to test the null hypothesis that the population mean inferred from a sample is equal to some given value. It can be described as below:
H0: μ = μ0 (population mean is equal to some hypothesized value μ0)There are actually three different alternative hypotheses:
- Two-tailed: The population mean is not equal to some given value
- Left-tailed: The population mean is less than some given value
- Right-tailed: The population mean is greater than some given value
We can use the following formula to calculate our test statistic:
t = (x – μ) / (s/√n)Where:
- x: the sample mean
- μ0: a hypothesized population mean
- s: the sample standard deviation
- n: the sample size
We then need to calculate the p-value using degrees of freedom equal to n – 1. If the p-value is less than your chosen significance level, we can reject the null hypothesis and say that the means differ.
Understanding the Two-Sample T-Test
The two-sample t-test is used to test whether two population means are equal (or if they differ in a significant way). In this case, the null hypothesis assumes that the two population means are equal.
When we sample two different groups, we are almost guaranteed that their sample means will differ. But the t-test allows us to test whether or not this difference is different in a statistically significant way.
Similar to the one-sample t-test, there are three different alternative hypotheses:
- Two-tailed: The two means are not equal
- Left-tailed: Population mean #1 is less than population mean #2
- Right-tailed: Population mean #1 is greater than population mean #2
The formula for the two-sample t-test can be written as:
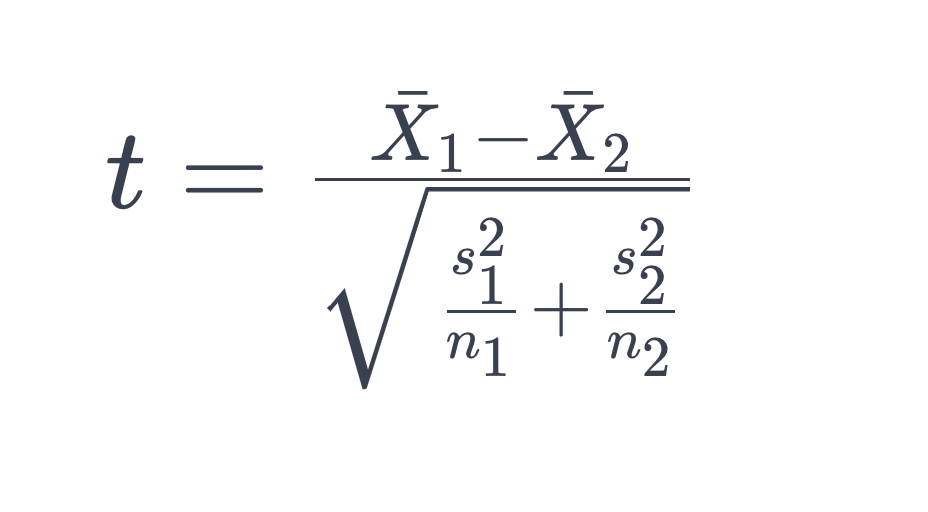
Where:
- X1 and X2 are the sample means of the two groups.
- s1 and s2 are the sample variances of the two groups.
- n1 and n2 are the sample sizes of the two groups.
We then need to calculate the p-value using degrees of freedom equal to (n1+n2-1). If the p-value is less than your chosen significance level, we can reject the null hypothesis and say that the means differ.
Requirements for the Student T-Test
Both types of t-tests follow a key set of assumptions, including:
- Observations should be independent of one another
- The data should be relatively normally distributed
- The samples should have approximately equal variances (this only applies to the two-sample t-test)
- The samples were collected using random sampling
It’s easy to test for these assumptions using Python (and I have included links to tutorials covering how to do this). Let’s take a look at example walkthroughs of how to conduct both of these tests in Python.
Perform a One-Sample T-Test in Python
In this section, you’ll learn how to conduct a one-sample t-test in Python. Suppose you are a teacher and have just given a test. You know that the population mean for this test is 85% and you want to see whether the score of the class is significantly different from this population mean.
Let’s start by importing our required function, ttest_1samp() from SciPy and defining our data:
from scipy.stats import ttest_1samp

# Sample data (exam scores of a class)
sample_scores = [75, 82, 88, 78, 95, 89, 92, 85, 88, 79]

# Population mean (hypothetical mean of all students' scores)
population_mean = 85
In the code block above, we first imported our required library. We then defined our sample as a list of values and defined our population mean as its own variable.
We can now pass these values into the function, as shown below:
# Perform one-sample t-test
t_statistic, p_value = ttest_1samp(sample_scores, population_mean)

# Output the results
print(f"t-statistic: {t_statistic}")
print(f"P-value: {p_value}")

# Returns:
# t-statistic: 0.04886615700133708
# P-value: 0.9620932123799038
The function returns a test statistic and the corresponding p-value. We can print these values out using f-strings to simplify the labeling, as shown above.
Finally, we can write a simple if-else statement to evaluate whether or not our sample mean is significantly different from the population mean:
# Check if the result is statistically significant (using a common significance level of 0.05)
if p_value < 0.05:
    print("The average exam score is significantly different from the population mean.")
else:
    print("There is no significant difference in the average exam score.")

# Returns:
# There is no significant difference in the average exam score.
We can see that by running this if-else statement, that our test indicates that there is no significant difference in the exam scores.
In order to calculate the different one-sample t-test alternative hypotheses, we can use the alternative= parameter:
alternative='two-sided'is the default value, checking for a two-sided alternative hypothesisalternative='less'checks whether the provided mean is less than the population meanalternative='greater'checks whether the provided mean is greater than the population mean
Now that you have a strong understanding of how to perform a one-sample t-test, let’s dive into the exciting world of two-sample t-tests!
Perform a Two-Sample T-Test in Python
A two-sample t-test is used to test whether the means of two samples are equal. The test requires that both samples be normally distributed, have similar variances, and be independent of one another.
Imagine that we want to compare the test scores of two different classes. This is the perfect example of when to use a t-test. Let’s begin by running a two-tailed test, which only evaluates whether or not the two means are equal. It begins with the null hypothesis, which states that the two means are equal.
Let’s take a look at how we can run a two-tailed t-test in Python:
# Running a Two-Tailed Two-Sample T-Test in Python
from scipy.stats import ttest_ind

# Generate two independent samples (example: exam scores of two classes)
class1_scores = [64, 58, 66, 75, 57, 57, 75, 67, 55, 65]
class2_scores = [80, 80, 87, 65, 67, 79, 74, 88, 75, 70]

# Perform two-sample t-test
t_statistic, p_value = ttest_ind(class1_scores, class2_scores)

# Output the results
print(f"t-statistic: {t_statistic}")
print(f"P-value: {p_value}")

# Returns:
# t-statistic: -3.747537032729207
# P-value: 0.001474009849334239
We can see that the ttest_ind() function returns both a test statistic and a p-value. We can run a simple if-else statement to check whether or not we can reject or fail to reject the null hypothesis:
# Check if the result is statistically significant (using a common significance level of 0.05)
if p_value < 0.05:
    print("There is a significant difference between the exam scores of the two classes.")
else:
    print("There is no significant difference between the exam scores of the two classes.")

# Returns:
# There is a significant difference between the exam scores of the two classes.
We can see that there is a significant difference between the two sets of scores. However, the two-tailed test doesn’t tell us in which direction.
In order to do this, we need to use a right- or left-tailed two-sample t-test. To do this in SciPy, we use the alternative= parameter. By default, this is set to 'two-sided'. However, we can modify this to either 'less' or 'greater', if we want to evaluate whether or not the mean for one sample is less than or greater than another.
Let’s see how we can check if the mean of class 2 is significantly higher than that of class 1:
# Running a Right-Tailed Two-Sample T-Test in Python
from scipy.stats import ttest_ind

# Generate two independent samples (example: exam scores of two classes)
class1_scores = [64, 58, 66, 75, 57, 57, 75, 67, 55, 65]
class2_scores = [80, 80, 87, 65, 67, 79, 74, 88, 75, 70]

# Perform two-sample t-test
t_statistic, p_value = ttest_ind(class2_scores, class1_scores, alternative='greater')

# Output the results
print(f"t-statistic: {t_statistic}")
print(f"P-value: {p_value}")

# Returns:
# t-statistic: 3.747537032729207
# P-value: 0.0007370049246671195
Because our p-value is less than our defined value of 0.05, we can say that the mean of class 2 is higher with statistical significance.
Conclusion
In conclusion, this comprehensive guide has equipped you with the knowledge and practical skills to perform t-tests in Python using the SciPy library. T-tests are invaluable tools for assessing statistical significance, particularly when working with smaller sample sizes.
Throughout this tutorial, you’ve gained insights into:
- The different types of t-tests and their applications.
- How to conduct one-sample and two-sample t-tests in Python.
- Interpretation of results obtained from statistical tests.
Remember that t-tests come with certain assumptions, and it’s crucial to validate them before applying these tests to your data. Python provides tools to check these assumptions, ensuring the robustness and reliability of your statistical analyses.
To learn more about these functions, check out the official documentation for the one-sample t-test and for the two-sample t-test in SciPy.