
In this tutorial, you’ll learn how to calculate the Pandas variance, including how to calculate the variance of a single column, multiple columns, and an entire Pandas Dataframe.
The Quick Answer: Use Pandas .var()
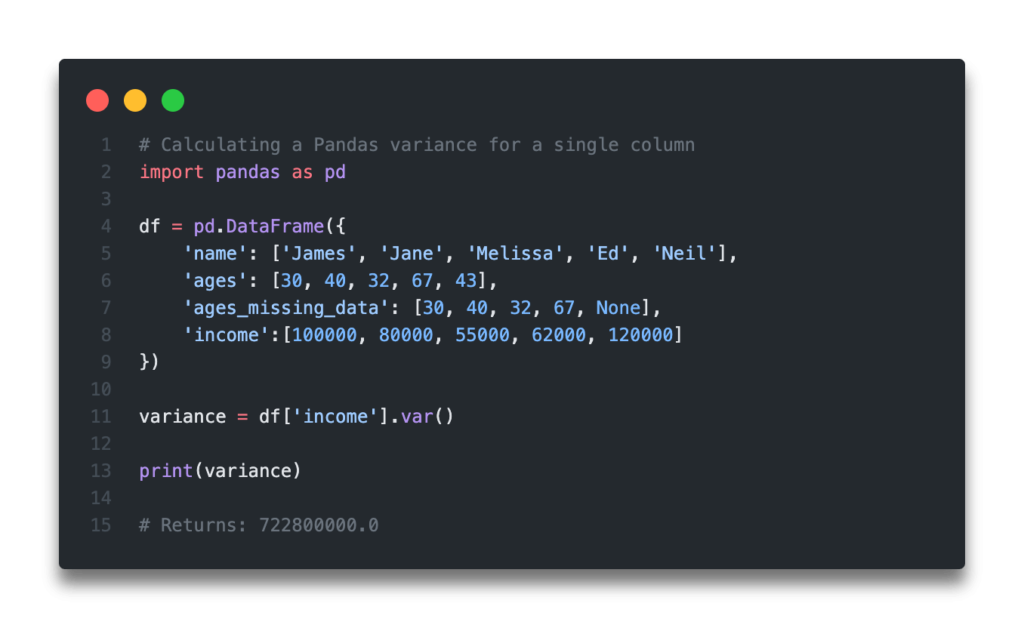
Table of Contents
What is the Variance Statistic?
The term variance is used to represent a measurement of the spread between numbers in a dataset. In fact, the variance measures how far each number if from the mean of all numbers, thereby providing a ways to identify how spread our numbers are.
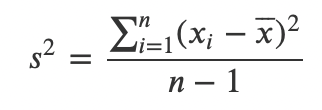
The variance is calculated by:
- Calculating the difference between each number and the mean
- Calculating the square of each difference
- Dividing the the sum of the squared differences by the number (minus 1) of observations in your sample
The formula for the variance looks like this:
Now that you have a good understanding of what the variance measure is, let’s learn how to calculate it using Python.
How to Calculate Variance in Python
Before we dive into how to calculate the variance using Pandas, let’s first understand how you can implement calculating the variance from scratch using Python.
# Calculate the variance from scratch in Python

numbers = [1,2,3,4,5,6,7,8,9]

def variance(observations):
    mean = sum(observations) / len(observations)
    squared_differences = 0
    for number in observations:
        difference = mean - number
        squared_difference = difference ** 2
        squared_differences += squared_difference
    variance = squared_differences / (len(observations) - 1)

    return variance

print(variance(numbers))

# Returns 7.5
In this code, we’ve done the following:
- Created a function that takes observations in the form of a list
- We first calculate the mean of the observations by dividing the sum of observations by the number of observations
- We create a new variable that will hold the squared differences and initialize at
0 - We then loop over each observation and calculate the difference from the mean and square it. This number is then added to the value of our squared differences
- Finally, we divide the sum of squared differences by the number of observations minus one
Thankfully, you don’t need to write this every time you want to calculate the variance of a Pandas dataset. In the next section, you’ll learn how to easily calculate the variance of a single column using Pandas.
Loading a Sample Pandas Dataframe
If you want to follow along with the tutorial, feel free to load the dataframe below. We’ll include a variety of columns, including one containing strings, one with missing data, and two numerical columns.
Let’s load the dataframe by using the code below:
# Loading a Sample Pandas Dataframe
import pandas as pd

df = pd.DataFrame({
    'name': ['James', 'Jane', 'Melissa', 'Ed', 'Neil'],
    'ages': [30, 40, 32, 67, 43],
    'ages_missing_data': [30, 40, 32, 67, None],
    'income':[100000, 80000, 55000, 62000, 120000]
})

print(df)

# Returns:
#       name  ages  ages_missing_data  income
# 0    James    30               30.0  100000
# 1     Jane    40               40.0   80000
# 2  Melissa    32               32.0   55000
# 3       Ed    67               67.0   62000
# 4     Neil    43                NaN  120000
Now that we have a dataframe to work with, let’s begin calculating the variance for the Pandas dataframe.
How to Calculate Variance in Pandas for a Single Column
Pandas makes it very easy to calculate to calculate the variance for a single column. For our first example, we’ll begin by calculating the difference for a single column that does not contain any missing data.
Let’s see how we can calculate the variance for the income column:
# Calculating a Pandas variance for a single column
import pandas as pd

df = pd.DataFrame({
    'name': ['James', 'Jane', 'Melissa', 'Ed', 'Neil'],
    'ages': [30, 40, 32, 67, 43],
    'ages_missing_data': [30, 40, 32, 67, None],
    'income':[100000, 80000, 55000, 62000, 120000]
})

income_variance = df['income'].var()

print(income_variance)

# Returns: 722800000.0
By default, Pandas will use n-1 as the denominator. If, instead, we wanted to use n as the denominator, we can use the ddof (delta degrees of freedom) argument and change its value to 0.
Let’s see what this would look like:
# Calculating a Pandas variance for a single column
import pandas as pd

df = pd.DataFrame({
    'name': ['James', 'Jane', 'Melissa', 'Ed', 'Neil'],
    'ages': [30, 40, 32, 67, 43],
    'ages_missing_data': [30, 40, 32, 67, None],
    'income':[100000, 80000, 55000, 62000, 120000]
})

income_variance = df['income'].var(ddof=0)

print(income_variance)

# Returns: 578240000.0
In the next section, you’ll learn how to deal with missing values when calculating a Pandas variance.
How to Deal with Missing Data in Calculating a Pandas Variance
In many cases, you may be working with imperfect data – namely, sometimes data may be missing. Because of this, you will need to make decisions as to how to treat missing data in your calculations. By default, Pandas will ignore missing data from its variance calculation.
Let’s take a look at calculating the variance of a column with missing data.
# Calculating a Pandas variance for a single column with missing data
import pandas as pd

df = pd.DataFrame({
    'name': ['James', 'Jane', 'Melissa', 'Ed', 'Neil'],
    'ages': [30, 40, 32, 67, 43],
    'ages_missing_data': [30, 40, 32, 67, None],
    'income':[100000, 80000, 55000, 62000, 120000]
})

missing_data_variance = df['ages_missing_data'].var()

print(missing_data_variance)

# Returns: 290.9166666666667
Now let’s take a look at what the variance looks like when we include our missing data:
# Calculating a Pandas variance for a single column with missing data
import pandas as pd

df = pd.DataFrame({
    'name': ['James', 'Jane', 'Melissa', 'Ed', 'Neil'],
    'ages': [30, 40, 32, 67, 43],
    'ages_missing_data': [30, 40, 32, 67, None],
    'income':[100000, 80000, 55000, 62000, 120000]
})

missing_data_variance = df['ages_missing_data'].var(skipna=False)

print(missing_data_variance)

# Returns: nan
We can see here that when a missing data exists in a column, then na is returned. In order to work around this, we could replace the missing data using either 0 or an imputed value.
In the next section, you’ll learn how to calculate the variance for multiple columns in Pandas.
How to Calculate Variance in Pandas for Multiple Columns
There may also be many times when you want to calculate the variance for multiple columns, in order to see the dispersion across related variables.
In order to do this, we can simply index the columns we want to calculate the variance for by using double square brackets [[]] and then use the .var() method.
Let’s see what this looks like:
# Calculating a Pandas variance for multiple columns
import pandas as pd

df = pd.DataFrame({
    'name': ['James', 'Jane', 'Melissa', 'Ed', 'Neil'],
    'ages': [30, 40, 32, 67, 43],
    'ages_missing_data': [30, 40, 32, 67, None],
    'income':[100000, 80000, 55000, 62000, 120000]
})

variances = df[['ages', 'income']].var()
print(variances)

# Returns:
# ages            218.3
# income    722800000.0
# dtype: float64
We can see here that as series of data is returned that provides the column name and the variances of those columns.
How to Calculate Variance in Pandas for a Dataframe
It’s even easier to calculate the variances for an entire dataframe. Pandas will recognize if a column is not numeric and will exclude the column from its variance analysis.
Simply pass the .var() method to the dataframe and Pandas will return a series containing the variances for different numerical columns.
Let’s take a look at what this looks like:
# Calculating a Pandas variance for an entire dataframe
import pandas as pd

df = pd.DataFrame({
    'name': ['James', 'Jane', 'Melissa', 'Ed', 'Neil'],
    'ages': [30, 40, 32, 67, 43],
    'ages_missing_data': [30, 40, 32, 67, None],
    'income':[100000, 80000, 55000, 62000, 120000]
})

variances = df.var()
print(variances)

# Returns:
# ages                 2.183000e+02
# ages_missing_data    2.909167e+02
# income               7.228000e+08
# dtype: float64
Conclusion
In this post, you learned what the variance statistic is, how to calculate it from scratch using Python, and how to easily calculate a Pandas variance for a single or multiple columns or for an entire dataframe.
To learn more about the Pandas .var() method, check out the official documentation here.