In this tutorial, you’ll learn how to split your Python dataset using Scikit-Learn’s train_test_split function. You’ll gain a strong understanding of the importance of splitting your data for machine learning to avoid underfitting or overfitting your models. You’ll also learn how the function is applied in many machine learning applications. Being able to split your data effectively means setting yourself up for success to build low-bias models.
By the end of this tutorial, you’ll have learned:
- Why you need to split your dataset in machine learning
- When and how to split subsets of your data to reduce the bias of your model
- How to use the train_test_split() function in Scitkit-Learn to split your dataset, including working with its helpful parameters
- How to visualize the splitting of your datasets
Table of Contents
Why Splitting Data is Important in Machine Learning
A critical step in supervised machine learning is the ability to evaluate and validate the models that you build. One way to achieve an effective and valid model is by using unbiased data. By reducing bias in your model, you can gain confidence that your model will also work well for new data.
In supervised machine learning, you are generally solving regression or classification problems. When building a model, you work with a dataset that has both inputs and outputs. In machine learning, these are often referred to as features and labels.
When you build a model using a given dataset, it’s unwise to use the same dataset to validate your model. This is because the model was built using that data and will perform with high degrees of success. So where do you find your data? Rather than generating new data, it’s often much better to split your initial dataset into different parts: a training and testing part.
You can fit a model using the training part of your dataset and validate it using the testing part of your dataset. Because of this, it’s important to ensure that you split your dataset effectively. A dataset that isn’t split effectively will often lead to two major problems: underfitting and overfitting your model.
Underfitting and Overfitting Data
A poorly split dataset, or one that’s not split at all, can lead to two common problems in machine learning. Namely, these problems are referred to as underfitting and overfitting a model.
Underfitting is a problem that occurs when a model doesn’t capture the relationships between different variables. A common cause of this can be when, say, including the incorrect variables. Similarly, it can occur when the wrong type of model is applied to a given problem. For example, applying a polynomial model to a model that actually linear. This type of problem will perform poorly in both training and testing data. Because of this, it can be easy to spot.
On the other hand, overfitting occurs when the model attempts to find overly complex relationships between variables that don’t actually exist. This is typically a problem when the dataset learns from both the true relationships (the “signal”) and from variables that have little influence (the “noise”). Generally, these types of models perform exceptionally well with training data, but quite poorly with testing data.
Understanding Scikit-Learn’s train_test_split Function
Let’s start off by learning how the function operates. In this section, you’ll learn how to load the function, what parameters the function expects, and what the function returns. The function is part of the model_selection module of the sklearn library. Let’s first import the function:
# Importing the train_test_split Function
from sklearn.model_selection import train_test_split
Rather than importing all the functions that are available in Scikit-Learn, it’s convention to import only the pieces that you need. The library is incredibly extensive and this can have performance implications on your code.
Now, let’s take a look at the parameters available in the train_test_split function:
# The parameters of the train_test_split Function
sklearn.model_selection.train_test_split(
    *arrays,
    test_size=None,
    train_size=None,
    random_state=None,
    shuffle=True,
    stratify=None
)
The only required parameters of the function are the arrays to be passed in. Generally, you’ll have two arrays of data: one containing your features and one containing your targets. Notice the * asterisk label in front of the parameter. This allows you to pass in an unspecified number of arguments into the function.
Let’s take a bit of a closer look at the parameters available in the function:
| Parameter | Default Value | Description |
|---|---|---|
arrays= | N/A | The arrays to split into training and testing datasets |
test_size= | None | A value between 0.0 and 1.0 that is used to define the proportion of records to represent the testing dataset. |
train_size= | None | A value between 0.0 and 1.0 that is used to define the proportion of records to represent the training dataset. If both test_size and train_size are set to None, this value will default to 0.25 (or 25%). |
random_state= | None | Accepts an integer to control the randomization during splitting. |
shuffle= | True | Whether to shuffle the dataset or not prior to splitting. |
stratify= | None | Can accept an array to determine how to split the data in a stratified manner. This is generally the labels of your data. |
The function returns a list containing different objects of the same type as those passed into the function as arrays. This list is twice as long as the arrays being passed into it. Logically, this makes sense. Imagine you pass in two arrays: features and labels. The function would return both a training and testing portion for each array.
Generally in machine learning, the features of a dataset are represented by the variable X. This makes reference to the x-axis generally representing the independent variables of a dataset The letter tends to be capitalized as it’s a multi-dimensional array.
Similarly, the labels of a dataset are referred to by the variable y. This makes reference to the y-axis generally holding the dependent variable of a dataset.
Let’s take a look at an example: you have two arrays X and y containing both the features and labels, respectively. Let’s see how this would generally be represented in machine learning. Remember, because you’re passing in two arrays, the function will return a list of four items.
# How to split two arrays
X_train, X_test, y_train, y_test = train_test_split(X, y)
On the left side of your equation are the four variables to which you want to assign the output of your function. Because you passed in two arrays, four different arrays of data are returned. By placing four variables on the left side, each of the four variables is assigned to the list items that are returned.
Splitting a Sample Dataset in Scikit-Learn
Now that you have a strong understanding of how the train_test_split() function works, let’s take a look at how Scikit-Learn can help preprocess your data by splitting it. This can be done using the train_test_split() function. To work with the function, let’s first load the wine dataset, bundled in the Scikit-Learn library. The dataset is a classification dataset, meaning that our models should predict a discrete value.
# Loading the wine dataset from sklearn
from sklearn.datasets import load_wine
from sklearn.model_selection import train_test_split

wine = load_wine()
print(wine.DESCR)

# Returns:
# .. _wine_dataset:

# Wine recognition dataset
# ------------------------

# **Data Set Characteristics:**

#     :Number of Instances: 178 (50 in each of three classes)
#     :Number of Attributes: 13 numeric, predictive attributes and the class
#     :Attribute Information:
#                 - Alcohol
#                 - Malic acid
#                 - Ash
In the code above, you loaded two functions from Scitkit-Learn:
load_wine()from thedatasetsmoduletrain_test_split()from themodel_selectionmodule
By calling the load_wine() function, a Bunch file is returned. The Bunch file acts similarly to a Python dictionary, meaning that you can easily access different pieces of information from it. In the code sample above, you used the DESCR value to return a description of the dataset.
Part of this bundle contains the actual value. You can access the features of the dataset by using the data key and the labels of the dataset using the target key. Let’s load the data into two variables. We’ll follow convention and assign these to X and y respectively.
# Loading the Wine Features and Labels
from sklearn.model_selection import train_test_split
from sklearn.datasets import load_wine

wine = load_wine()
X = wine.data
y = wine.target
Now that you have two of the arrays loaded, you can split them into testing and training data using the test_train_split() function:
# Using train_test_split to Split Data into Training and Testing Data
X_train, X_test, y_train, y_test = train_test_split(X, y, test_size=0.3, random_state=100, stratify=y)
You now have four different variables created: a testing and training dataset for each X and y. We asked Scikit-Learn to stratify the dataset. This can be helpful when you’re trying to classify an imbalanced dataset, where there isn’t a balance between the different classes.
We can see whether or not this was required by checking the counts of each label in the y array:
import pandas as pd
df = pd.DataFrame(y)
print(df.value_counts())

# Returns:
# 1    71
# 0    59
# 2    48
# dtype: int64
We can see that there is some imbalance, but the dataset is relatively well distributed. You probably could be ok without stratifying the split. Let’s see how this can be done:
# Returning a Non-Stratified Result
X_train, X_test, y_train, y_test = train_test_split(X, y, test_size=0.3, random_state=100, shuffle=True)
We can now compare the sizes of these different arrays. Because we’re interested primarily in how many records exist in either the training and testing sets, we can look at either X or y. Because y is a simpler, one-dimensional data structure we can simply calculate their lengths:
# Seeing the split across training and testing datasets
print('Number of records in the original dataset: ', len(y))
print('Number of records in the training dataset: ', len(y_train))
print('Number of records in the testing dataset: ', len(y_test))

# Returns:
# Number of records in the original dataset:  178
# Number of records in the training dataset:  124
# Number of records in the testing dataset:  54
In the final section of this tutorial, you’ll learn how to visualize the effect of splitting your data into training and testing data.
Visualizing Splitting Training and Testing Data
In this section, you’ll learn how to visualize a dataset that has been split using the train_test_split function. Because our data is categorical in nature, we can use Seaborn’s catplot() function to create a scatterplot of the data. There is no practical purpose to doing this, other than to visualize how data are being split. It allows you to understand the randomness of the sampling, as well as any stratification that may have been applied.
Let’s take a look at the first feature, which we can access by accessing the 0th column of a Pandas DataFrame.
# Generate a Two Column DataFrame
import matplotlib.pyplot as plt
import seaborn as sns

data = pd.DataFrame(X)
df = pd.DataFrame()
df['Features'] = data[0]
df['Targets'] = y

# Split and Label the Data
df_train, df_test = train_test_split(df)
df_train['Type'] = 'Train'
df_test['Type'] = 'Test'

# Combine the Data
final_df = df_train.append(df_test)

# Visualize the Data
sns.set_style('darkgrid')
sns.set_palette('pastel')
sns.catplot(data=final_df, x='Targets', y='Features', hue='Type')
plt.show()
This returns the following image, illustrating the split created by the train_test_split function:
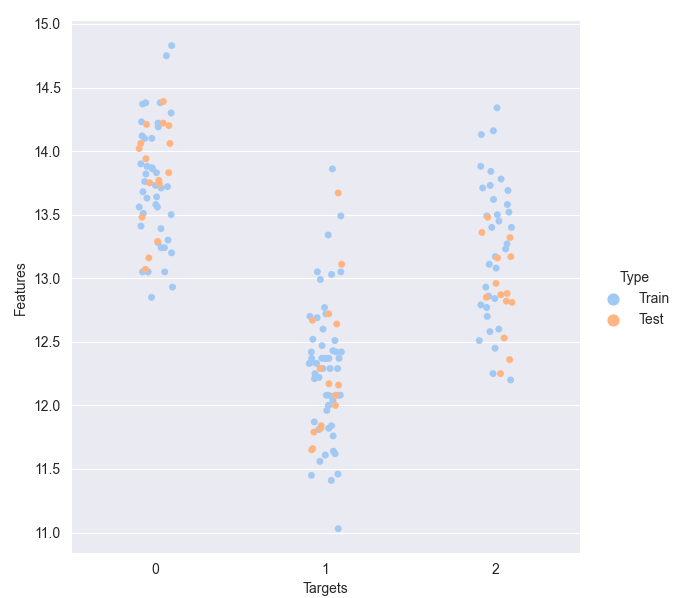
You can see the sampling of data points throughout the different values. Keep in mind, this is only showing a single dimension and the dataset contains many more features that we filtered out for simplicity.
Conclusion and Recap
In this tutorial, you learned how to use the train_test_split() function in Scikit-Learn. The section below provides a recap of everything you learned:
- Splitting your data into training and testing data can help you validate your model
- Ensuring your data is split well can reduce the bias of your dataset
- Bias can lead to underfitting or overfitting your model, both leading to poor model results
- The train_test_split function returns twice as many arrays as are passed into it
Additional Resources
To learn more about related topics, check out the tutorials below:
Hello,
Maybe you could add ‘import seaborn as sns’ and ‘import matplotlib.pyplot as pltIn’ in the ‘Visualizing Splitting Training and Testing Data’ code for completeness.
Great idea! Thank you :). I have updated the post.