In this tutorial, you’ll learn what Scikit-Learn is, how it’s used, and what its basic terminology is. While Scikit-learn is just one of several machine learning libraries available in Python, it is one of the best known. The library provides many efficient versions of a diverse number of machine learning algorithms. Its approachable methods and extensive online documentation make it a great tool for beginners and novices alike.
By the end of this tutorial, you’ll have:
- Gained an overview of the Scikit-Learn library,
- Developed a strong understanding of the libraries API elements, and
- Worked through an early machine learning example using one of the included datasets
Table of Contents
What is Scikit-Learn in Python?
Scikit-Learn is a free machine learning library for Python. It supports both supervised and unsupervised machine learning, providing diverse algorithms for classification, regression, clustering, and dimensionality reduction. The library is built using many libraries you may already be familiar with, such as NumPy and SciPy. It also plays well with other libraries, such as Pandas and Seaborn.
How Do You Install Scikit-Learn in Python?
Installing Scikit-Learn can be done using either the pip package manager or the conda package manager. Simply write the code below into your command line editor or terminal and let the package manager handle the installation for you:
pip install sklearn
conda install sklearn
The package manager will handle installing any required dependencies for the Scikit-learn library you may not already have installed. Once you’ve installed Scikit-learn, try writing the script below and running it. If it runs without issue, then you successfully installed Scikit-learn!
# Importing all of scikit-learn
import sklearn
In the next section, you’ll learn how to load data in Scikit-Learn.
How Is Data Represented in Scikit-Learn?
In order to discuss how data is represented in Scikit-Learn, let’s load a dataset. The library provides access to many different datasets, one of which is the famous iris dataset. The dataset is so famous that it’s often referred to as the “hello world” of machine learning!
Let’s see how you can load that dataset:
# Loading the iris dataset
from sklearn.datasets import load_iris
iris = load_iris()
print(type(iris))

# Returns: <class 'sklearn.utils.Bunch'>
In the code snippet above, you loaded the load_iris() function from the datasets module of sklearn. You then printed the type of that object. This is a type of object that you may not yet have encountered: the Bunch object. This object is actually quite similar to a dictionary, meaning that it contains keys and values. Let’s take a look at the keys available in this object:
# Looking at the dataset Bunch object
print(iris.keys())

# Returns: dict_keys(['data', 'target', 'frame', 'target_names', 'DESCR', 'feature_names', 'filename'])
Let’s take a look at what this DESCR (description) of the dataset shows, by printing out its contents:
# Getting the description of a dataset using the DESCR key
print(iris.DESCR)

# Returns:
# .. _iris_dataset:

# Iris plants dataset
# --------------------

# **Data Set Characteristics:**

#     :Number of Instances: 150 (50 in each of three classes)
#     :Number of Attributes: 4 numeric, predictive attributes and the class
#     :Attribute Information:
#         - sepal length in cm
#         - sepal width in cm
#         - petal length in cm
#         - petal width in cm
#         - class:
#                 - Iris-Setosa
#                 - Iris-Versicolour
#                 - Iris-Virginica
# ...
The full description is truncated, as it continues on for quite a bit longer. I encourage you to print it out yourself and take a look through it, as it gives you a helpful overview of the data in the dataset.
What’s important to take away here is that:
- The dataset’s description is readily available to you in
sklearn - The data has many unique attributes and these are described in the description
One of the other keys in the dataset Bunch object is the data key. This key actually holds the data. Let’s take a look at the type of this dataset:
# Checking the type of the dataset
print(type(iris.data))

# Returns: <class 'numpy.ndarray'>
We can see that by accessing the type of the data key, that it holds a Numpy array. Let’s print out the first five records of this array:
# Taking a look at the iris dataset
print(iris.data[:5])

# Returns:
# [[5.1 3.5 1.4 0.2]
#  [4.9 3.  1.4 0.2]
#  [4.7 3.2 1.3 0.2]
#  [4.6 3.1 1.5 0.2]
#  [5.  3.6 1.4 0.2]]
We can see that the dataset contains four different features. A feature in this case refers to a measurable characteristic or property. Since our array is unlabeled, how can we access information about what these values actually represent?
In order to do this, we can use the feature_names key. Let’s print out the contents of that key:
# Accessing feature names
print(iris.feature_names)

# Returns:
# ['sepal length (cm)', 'sepal width (cm)', 'petal length (cm)', 'petal width (cm)']
Accessing this key returns a list of all the different keys. We can see that the length and width of the sepal and the petal of different flower species are provided. If you’re not a botanist, chances are you may need a refresher on what these terms refer to. Take a look at the picture below to see the difference between these two parts of a flower.

The idea behind this dataset is to use the data to predict the species of a flower based on these attributes. Before we dive into using the data, let’s keep exploring what’s available in the Bunch data file. Let’s explore the target and target_names keys:
# Exploring target and target names
print(iris.target_names)
print(iris.target)

# Returns:
# ['setosa' 'versicolor' 'virginica']
# [0 0 0 0 0 0 0 0 0 0 0 0 0 0 0 0 0 0 0 0 0 0 0 0 0 0 0 0 0 0 0 0 0 0 0 0 0
#  0 0 0 0 0 0 0 0 0 0 0 0 0 1 1 1 1 1 1 1 1 1 1 1 1 1 1 1 1 1 1 1 1 1 1 1 1
#  1 1 1 1 1 1 1 1 1 1 1 1 1 1 1 1 1 1 1 1 1 1 1 1 1 1 2 2 2 2 2 2 2 2 2 2 2
#  2 2 2 2 2 2 2 2 2 2 2 2 2 2 2 2 2 2 2 2 2 2 2 2 2 2 2 2 2 2 2 2 2 2 2 2 2
#  2 2]
With this, we can see that the index position of the target_names key refers to the values 0 through 2.
Your First Machine Learning Project: Classifying Data
Now that you have a strong understanding of the dataset and how the data can be accessed in sklearn, let’s take a look at using the data for your very first machine learning project! The resulting labels that you’ll be aiming to produce are discrete. They represent a single species of flower. Since they are discrete, this means that you’re working on a classification project. Because you already have labels available in your dataset, this will also be an example of supervised learning.
Loading and Representing Data Using Scikit-Learn in Python
Let’s start again by exploring the data. You’ve already learned how to access the data. Let’s explore the data a little bit. Because the dataset is such a commonly used dataset, it’s actually built into the Seaborn library. It’ll be a little bit easier to explore using that library so let’s load it through there.
# Exploring the iris dataset
from sklearn.datasets import load_iris
from sklearn.model_selection import train_test_split
from sklearn.tree import DecisionTreeClassifier, plot_tree
from sklearn import metrics

import pandas as pd
import seaborn as sns
import matplotlib.pyplot as plt

df = sns.load_dataset('iris')
print(df.head())

# Returns:
#    sepal_length  sepal_width  petal_length  petal_width species
# 0           5.1          3.5           1.4          0.2  setosa
# 1           4.9          3.0           1.4          0.2  setosa
# 2           4.7          3.2           1.3          0.2  setosa
# 3           4.6          3.1           1.5          0.2  setosa
# 4           5.0          3.6           1.4          0.2  setosa
Let’s create a Seaborn pairplot(), which plots pairwise relationships in a dataset. The method takes a Pandas DataFrame and plots it. Similarly, it lets you use the hue= parameter to color your data by another column. Let’s see what this looks like:
# Creating a pairplot with Seaborn
sns.pairplot(df, hue='species')
plt.show()
This returns the following image:

Because our dataset has four features, there are four rows and columns. The colors are based on the target variable (the resulting label). We can see how for a lot of the pairwise combinations result in visually discernable clusters! This is great news.
Why is this great news? Since there are distinct differences between the groups, our machine learning model should easily be able to identify the differences between the groups.
Building Your First Model Using Scikit-Learn in Python
Now that you have a good understanding of the shape and distribution of your data, let’s take a look at how building a model works in Scikit-Learn! While these steps can sometimes be broken down into multiple steps, below you’ll find the four main steps to building a model:
- Define the model: decide on the type of model you’ll use, such as regression or classifier. In this case, you’ll be building a classifier as your resulting labels will be discrete.
- Fit the data: this involves capturing the patterns of the data. While there are many technical and mathematical complexities behind the scenes, Scikit-learn handles most of those for you.
- Predict data: Use the model you created above to make predictions on the testing data
- Evaluate your model: since you have a testing dataset with its true labels, you’re able to calculate a metrics indicating how accurate your model is.
Let’s begin with step #1: we’ll define our model. Because this tutorial is meant as an introductory look at Scikit-Learn, let’s build a model that can be very easily and visually understood. We’ll use a Decision Tree Classifier to model our algorithm.
Splitting Your Data into Training and Testing Data Using Scikit-Learn in Python
Our first step will be to split up our data into training and testing datasets. It’s convention to load the features and the targets into separate variables, X and y respectively. Remember, these values are stored in the .data and .target keys of the Bunch object. We can then use the train_test_split() function to split our data into training and testing data.
It may look like you’re importing a lot of different pieces. And, really, you are. This may seem strange and intimidating, but it’s something that as you progress down your machine learning journey you’ll get more and more familiar with! Each of these different imports will be explained throughout the tutorial.
# Loading and splitting your data
from sklearn.datasets import load_iris
from sklearn.model_selection import train_test_split
from sklearn.tree import DecisionTreeClassifier, plot_tree
from sklearn import metrics

import pandas as pd
import seaborn as sns
import matplotlib.pyplot as plt

iris = load_iris()
X = pd.DataFrame(iris.data)
y = pd.DataFrame(iris.target)

X_train, X_test, y_train, y_test = train_test_split(X, y, test_size=0.3, stratify=y, random_state=100)
Let’s break this down a little bit before continuing:
- You loaded the
irisdataset into an object caleldiris - You created two DataFrames,
Xandy, holding the features and the labels. Note thatXis a capital andyis not. While this is not necessary, it is convention. - You then created four additional variables using the
train_test_splitfunction from themodel_selectionmodule. These DataFrames are your training and testing datasets. You defined your test size to be 30% and to stratify the data using the targets. Therandom_state=100allows you to be able to reproduce this analysis.
These four resulting objects are actually Pandas DataFrames. This means that you can actually explore them, like you would any other DataFrame. Let’s take a look at the sizes of them:
# Exploring the training and testing datasets
print("X_train's shape is ", X_train.shape)
print("X_test's shape is ", X_test.shape)
print("y_train's shape is ", y_train.shape)
print("y_test's shape is ", y_test.shape)

# Returns:
# X_train's shape is  (105, 4)
# X_test's shape is  (45, 4)
# y_train's shape is  (105, 1)
# y_test's shape is  (45, 1)
The resulting DataFrames are split into 70% and 30% chunks of the former DataFrames. The features DataFrames continue to have four columns, while the target DataFrames only have one.
Creating Your Decision Tree Classifier Using Scikit-Learn in Python
Now that you have your data loaded, you can start building your model!
# Creating your first model
model = DecisionTreeClassifier(max_depth=3, random_state=100)
print(type(model))

# Returns: <class 'sklearn.tree._classes.DecisionTreeClassifier'>
In the code above, you created an object model, which is a DecisionTreeClassifier. So far, you’ve only passed in instructions, telling Scikit-Learn that the tree should only have a depth of 3 and the random_state of 100 to reproduce your results. You’ve created the shell of a model, but you have yet modeled the data.
The DecisionTreeClassifier object has a method, .fit(), which allows you to pass in your two training variables. This method allows your model to use that data to develop a decision tree. In this step, Scikit-Learn is building your model!
# Fitting your data to a model
model.fit(X_train, y_train)
Visualizing Your Model Using Scikit-Learn in Python
While on the surface, nothing happens when you run this code, behind the scenes a lot is actually happening! Scikit-learn is building the decision tree for you! We can actually see this tree by importing the plot_tree module from the tree module. Let’s take a look at the decisions that the tree will be using:
# Visualizing your first decision tree
plot_tree(
    model,
    feature_names=iris.feature_names,
    class_names=iris.target_names,
    filled=True
)
plt.title('Your First Decision Tree Classifier', size=18, color='grey')
plt.show()
This returns the following image:
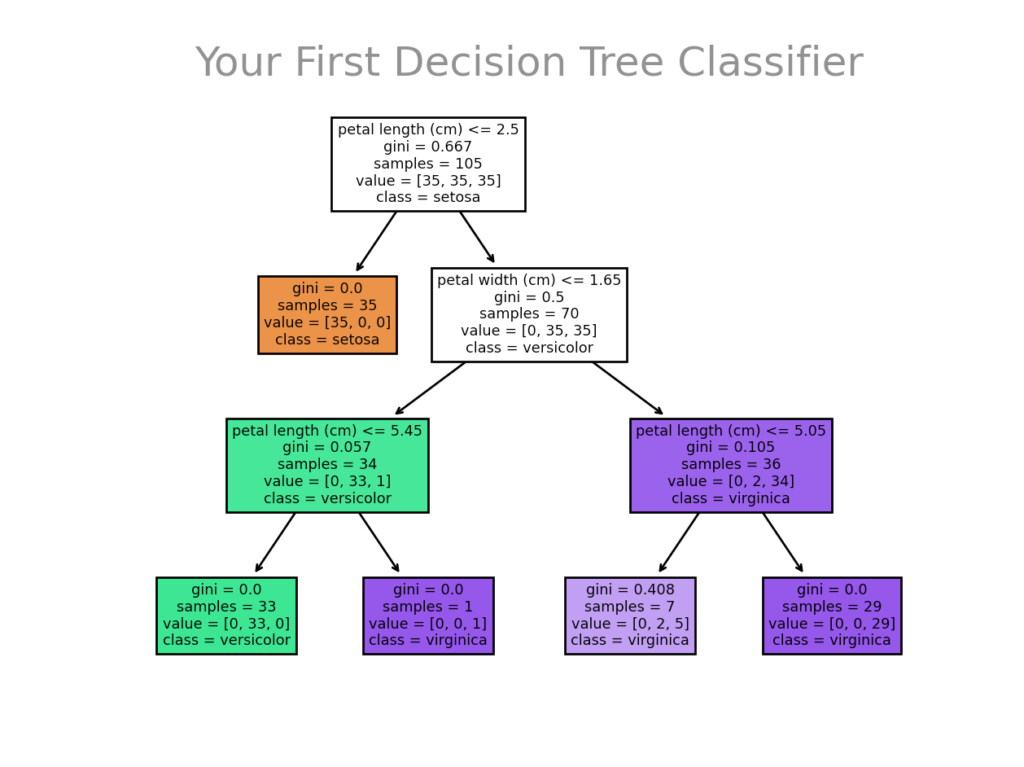
Let’s break down what we did in the code of the plot_tree() function:
- The first parameter should be your model, which in this case you called
model - The
feature_namesrepresents the columns in the training dataset. These can be found using thefeature_nameskey of theirisobject. - The
class_namesrepresents the actual labels of the dataset, which in this case are the species of flowers. filled=Truesimply instructs Scikit-Learn to color our decision tree plot
Now let’s take a look at the image itself. Each box represents a decision point (unless it’s the final box, in which case it represents a decision itself). If the values in the box are match our data point, then the arrow traverses to the left. If the decision does not match the criteria, it moves to the right.
In the case above, only the petal width and length are considered. This is because the depth of our tree is a limiting factor that we set. You can actually check this by using the feature_importances_ attribute of the model. Let’s see what this looks like:
# Seeing how important each feature is to the model
print(model.feature_importances_)

# Returns:
# [0.         0.         0.56389932 0.43610068]
This breaks down, out of 100%, how important each feature is to the model. Because both sepal width and length have a value of 0%, they are not considered at all. This verifies what we saw in the tree visual.
Evaluating Your First Model Using Scikit-Learn in Python
Now it’s time to see how well our model actually performed! In order to this, you’ll first need to instruct your model to predict data. In order to do this, you can use the .predict() method on your model. The method expects the features of the testing dataset.
# Making predictions with your model
prediction = model.predict(X_test)
print(prediction)

# Returns:
# [0 1 2 1 2 0 1 0 0 0 1 1 1 0 1 2 2 2 1 1 2 1 1 2 1 0 1 1 0 2 2 2 2 0 1 2 0
#  0 0 1 0 0 0 1 2]
In the code above, you loaded a new variable prediction. This was created by using the .predict() method using the testing data from your features dataset. This actually simply returns a NumPy array of the predicted values!
Because you also have an array of the true values for the labels, you’re able to easily check how accurate your model is! This can be done by using the accuracy_score() function of the metrics module, as shown below:
# Evaluating the accuracy of your model
accuracy = metrics.accuracy_score(y_true=y_test, y_pred=prediction)
print(accuracy)

# Returns: 0.9555555555555556
The accuracy_score() function expects two main parameters: the y_true represents the true labels of your data and y_pred expects the model’s predictions.
It’s important to note that accuracy is just a single criterion for evaluating the performance of a classification problem. If you want to learn more about this, check out my in-depth post on calculating and visualizing a confusion matrix in Python.
From the code above, you can see that the accuracy of the model is 95.6%! This means that the model should be able to predict the species of a flower 95.6% of the time given these values.
Exercises
It’s time to check your understanding! Try and complete the exercises below. If you need a hint or want to check the solution, simply toggle the question.
What is the use of the random_state parameter in many of the Scikit-Learn functions?
The random_state parameter allows you to pass in an integer value to help you be able to reproduce the results of your analysis. Because machine learning should be reproducible and verifiable, this is an important variable.
Currently, only two features of your dataset are considered. How could you include more?
There are two simple ways in which you could include more features:
- Modfiying the
random_statevariable - Increasing the depth of your tree. Currently, the tree can only go to three levels. This limits how many decisions your tree can make.
Note: it’s not always a good idea to increase your tree depth. This can lead to overfitting your data. Be mindful of the depths you use.
Based on the pairwise plot you created in the tutorial, does it make sense to you that petal length and width would be important features?
The pairwise plot that was created shows amplified clustering in the petal length and width variables. On the other hand, the sepal width and length have more overlapped samples. Because of this, it makes sense that a decision tree would place more emphasis on the petal measurements.
Conclusion and Recap
In this tutorial, you learned the basics of Python’s Scikit-Learn library. You learned what the library is and how it can be used. The section below provides a recap of what you learned in this tutorial:
- Scikit-Learn is a machine learning library available in Python
- The library can be installed using
piporcondapackage managers - The data comes bundled with a number of datasets, such as the
irisdataset - You learned how to build a model, fit a model, and evaluate a model using Scikit-Learn
- You built a decision tree classifer model to predict the species of flower given sepal and petal measurements
Additional Resources
To learn more about related topics, check out the tutorials below:
Hey!
Thank you for this helpful tutorial.
in “# Exploring the iris dataset” you load the dataset as sns. I’wondering why it’s not loaded as a pandas dataframe. What’s the purpose?
Kind regards
Hi Flo,
Great question! The seaborn load_dataset function actually does return a Pandas DataFrame :). It’s a bit more convenient early on than using the sklearn dataset functions (IMO), but both ways can return a DataFrame.