
Learn how to normalize a Pandas column or dataframe, using either Pandas or scikit-learn.
Normalization is an important skill for any data analyst or data scientist. Normalization involves adjusting values that exist on different scales into a common scale, allowing them to be more readily compared. This is especially important when building machine learning models, as you want to ensure that the distribution of a column’s values don’t get over- or under-represented in your models.
In this tutorial, you’ll learn how to use Pandas and scikit-learn to normalize both a column and an entire dataframe using maximum absolute scaling, min-max feature scaling, and the z-score scaling method. You’ll also learn what these methods represent, as well as when and why to use each one.
The Quick Answer:
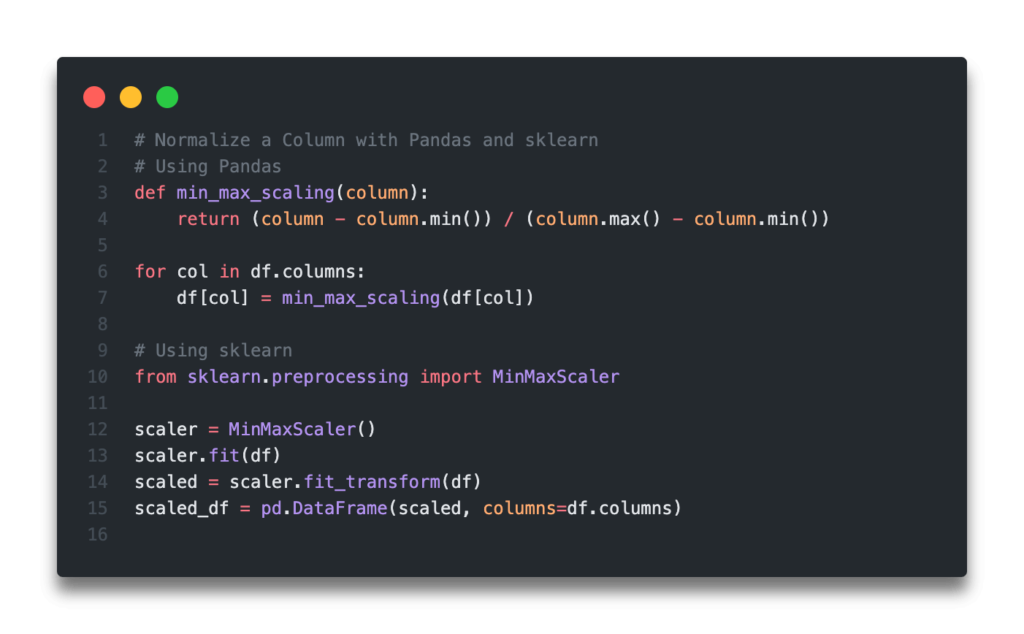
Table of Contents
What is Data Normalization in Machine Learning?
Data normalization takes features (or columns) of different scales and changes the scales of the data to be common. For example, if you’re comparing the height and weight of an individual, the values may be extremely different between the two scales. Because of this, if you’re attempting to create a machine learning model, one column may be weighed differently.
This is where normalization comes into play: the values of the different columns are adjusted, so that they exist on a common scale, allowing them to be more easily compared.
In the following sections, you’ll learn how to apply data normalization to a Pandas Dataframe, meaning that you adjust numeric columns to a common scale. This prevents the model from favouring values with a larger scale. In essence, data normalization transforms data of varying scales to the same scale. This allows every variable to have similar influence on the model, allowing it to be more stable and increase its effectiveness.
Let’s begin by loading a sample Pandas Dataframe that we’ll use throughout the tutorial.
Loading a Sample Pandas Dataframe
If you want to follow along with the tutorial, line of code for line of code, copy the code below to create the dataframe. This will generate a sample dataframe that you can use to follow along with the tutorial.
We’ll load a dataframe that has three columns: age, weight, and height. Let’s see how we can do this in Python and Pandas:
import pandas as pd

df = pd.DataFrame.from_dict({
    'Age': [10, 35, 34, 23, 70, 55, 89],
    'Height': [130, 178, 155, 133, 195, 150, 205],
    'Weight': [80, 200, 220, 150, 140, 95, 180]
})
We can print the first five rows of our dataframe by using the print(df.head()) command. This will return the following dataframe:
   Age  Height  Weight
0   10     130      80
1   35     178     200
2   34     155     220
3   23     133     150
4   70     195     140
In the next section, you’ll learn what maximum absolute scaling is.
What is Maximum Absolute Scaling?
The maximum absolute scaling method rescales each feature to be a value between -1 and 1.
Each value is calculated using the formula below:
xscaled = x / max(|x|)
Each scaled value is calculated by dividing the value itself by the absolute value of the maximum value. Just because the scale can go from -1 to 1, doesn’t mean it will. In fact, the values of negative -1 and +1 will only exist when both negative and positive values of the maximum values exist in the dataset. This means that at least either or both a -1 or +1 will exist.
In the next section, you’ll learn how to normalize a Pandas column with maximum absolute scaling using Pandas.
Check out some other Python tutorials on datagy, including our complete guide to styling Pandas and our comprehensive overview of Pivot Tables in Pandas!
Normalize a Pandas Column with Maximum Absolute Scaling using Pandas
Pandas makes it easy to normalize a column using maximum absolute scaling. For this process, we can use the .max() method and the .abs() method. To learn more about the absolute function and how to use it in Python, check out my in-depth post here.
Let’s see how we can develop a function that allows us to apply the maximum absolute scaling method to a column:
def absolute_maximum_scale(series):
    return series / series.abs().max()

for col in df.columns:
    df[col] = absolute_maximum_scale(df[col])

print(df)

# Returns:
#         Age    Height    Weight
# 0  0.112360  0.634146  0.363636
# 1  0.393258  0.868293  0.909091
# 2  0.382022  0.756098  1.000000
# 3  0.258427  0.648780  0.681818
# 4  0.786517  0.951220  0.636364
# 5  0.617978  0.731707  0.431818
# 6  1.000000  1.000000  0.818182
What we’ve done here is defined a function that divides the series by the absolute value of the maximum value in the series. We then apply that function to every column in our dataframe.
The benefit here is that we can choose what columns to apply the function to, rather than immediately applying it to an entire dataframe, every single time.
In the next section, you’ll learn how to use scikit-learn to apply maximum absolute scaling to a Pandas Dataframe.
Normalize a Pandas Column with Maximum Absolute Scaling using scikit-learn
In many cases involving machine learning, you’ll import the popular machine-learning scikit-learn library. Because of this, you can choose to use the library to apply maximum absolute scaling to your Pandas Dataframe.
For this, we’ll use the MaxAbsScalaer class to create a scalar object. We can then apply the fit method to allow scikit-learn to learn about the parameters required for this (the maximum absolute value). We then use the parameters to transform our data and normalize our Pandas Dataframe column using scikit-learn.
let’s see how we can use Pandas and scikit-learn to accomplish this:
# Use Scikit-learn to transform with maximum absolute scaling
scaler = MaxAbsScaler()
scaler.fit(df)
scaled = scaler.transform(df)
scaled_df = pd.DataFrame(scaled, columns=df.columns)

print(scaled_df)

# Returns:
#         Age    Height    Weight
# 0  0.112360  0.634146  0.363636
# 1  0.393258  0.868293  0.909091
# 2  0.382022  0.756098  1.000000
# 3  0.258427  0.648780  0.681818
# 4  0.786517  0.951220  0.636364
# 5  0.617978  0.731707  0.431818
# 6  1.000000  1.000000  0.818182
Let’s break down what we’ve done here:
- We load a
scalerobject using theMaxAbsScaler()class - We pass the dataframe into the
.fit()method - We then create a scaled matrix of data using the
.transform()method - Finally, we recreate a Pandas Dataframe using the
DataFrameclass
In the next section, you’ll learn about the min-max feature scaling method.
What is Min-Max Feature Scaling?
Min-max feature scaling is often simply referred to as normalization, which rescales the dataset feature to a range of 0 - 1. It’s calculated by subtracting the feature’s minimum value from the value and then dividing it by the difference between the maximum and minimum value.
The formula looks like this:
xnorm = x - xmin / xmax - xmin
Pandas makes it quite easy to apply the normalization via the min-max feature scaling method.
in the next section, you’ll learn how to use Pandas to normalize a column.
Normalize a Pandas Column with Min-Max Feature Scaling using Pandas
To use Pandas to apply min-max scaling, or normalization, we can make use of the .max() and .min() methods. We can then apply a function using a vectorized format to significantly increase the efficiency of our operation.
Let’s see what this looks like in Pandas:
def min_max_scaling(series):
    return (series - series.min()) / (series.max() - series.min())

for col in df.columns:
    df[col] = min_max_scaling(df[col])

print(df.head())

# Returns:
#         Age    Height    Weight
# 0  0.000000  0.000000  0.000000
# 1  0.316456  0.640000  0.857143
# 2  0.303797  0.333333  1.000000
# 3  0.164557  0.040000  0.500000
# 4  0.759494  0.866667  0.428571
Let’s break down what we’ve done here:
- We defined our function to accept a series
- The function returns the formula defined above: the difference between the value and the minimum value, divided by the difference between the maximum and minimum values
In the example above, we loop over each column. While we could define our function to normalize the entire dataframe. Instead, we chose to normalize it column by column, allowing us to skip over columns that are not numerical and can’t use the same standardization method.
In the next section, you’ll learn how to use sklearn to normalize a column using the min-max method.
Normalize a Pandas Column with Min-Max Feature Scaling using scikit-learn
The Python sklearn module also provides an easy way to normalize a column using the min-max scaling method.The sklearn library comes with a class, MinMaxScaler, which we can use to fit the data.
Let’s see how we can use the library to apply min-max normalization to a Pandas Dataframe:
from sklearn.preprocessing import MinMaxScaler

scaler = MinMaxScaler()
scaler.fit(df)
scaled = scaler.fit_transform(df)
scaled_df = pd.DataFrame(scaled, columns=df.columns)

print(scaled_df)

# Returns:
#         Age    Height    Weight
# 0  0.000000  0.000000  0.000000
# 1  0.316456  0.640000  0.857143
# 2  0.303797  0.333333  1.000000
# 3  0.164557  0.040000  0.500000
# 4  0.759494  0.866667  0.428571
# 5  0.569620  0.266667  0.107143
# 6  1.000000  1.000000  0.714286
Similar to applying max-absolute scaling method, let’s explore what we’ve done here:
- We imported the
MinMaxScalerclass fromsklearn.preprocessing - We then create an instance of the class and fit it to the data
- We then use the scaler to fit and transform our data
- Finally, we create a new dataframe from the data, passing in the original columns to recreate it
In the next section, you’ll learn what z-score scaling is and how to use it.
Check out some other Python tutorials on datagy.io, including our complete guide to styling Pandas and our comprehensive overview of Pivot Tables in Pandas!
What is Z-Score Scaling?
The z-score method is often referred to as standardization, which transforms the data into a distribution of values where the mean is 0 and has a standard deviation of 1. Unlike the other two methods, this method doesn’t range from 0-1 or -1 to
Instead, because the data uses a standard deviation, 99% of values will fall into the range of -3 through 3. Of course, you’ll have values that can extend beyond that, but they’ll just be extremely uncommon.
The way that this standardization is calculated is to use the following formula:
xstd = x - μ / σ
In the next section, you’ll learn how to standardize a Pandas column using z-score scaling.
Standardize a Pandas Column with Z-Score Scaling using Pandas
In order to standardize a column in a Pandas Dataframe, we can make good use of the Pandas mean and std functions.
To learn more about calculating a mean of a Pandas Dataframe column, check out this tutorial here. To learn more about calculating a standard deviation in Python, check out my tutorial here, which includes everything from calculating it from scratch to using Pandas.
Let’s see how we can use Pandas to calculate a standardized dataframe with z-score scaling:
def z_score_standardization(series):
    return (series - series.mean()) / series.std()

for col in df.columns:
    df[col] = z_score_standardization(df[col])

print(df)

# Returns:
#         Age    Height    Weight
# 0 -1.270474 -1.141772 -1.384428
# 1 -0.366682  0.483802  0.918383
# 2 -0.402833 -0.295119  1.302185
# 3 -0.800502 -1.040174 -0.041122
# 4  0.898628  1.059526 -0.233023
# 5  0.356352 -0.464450 -1.096577
# 6  1.585510  1.398187  0.534581
Let’s explore what we’ve done here:
- We define a new function that accepts a series as its input
- We then return the series’s value subtracted from the series’s mean, which is divided by the series’s standard deviation
Finally, we loop over every column in the dataframe and re-assign it to itself.
Standardize a Pandas Column with Z-Score Scaling using scikit-learn
In this final section, you’ll learn how to use sklearn to standardize a Pandas column using z-score scaling. In order to this, we use the StandardScaler class from the sklearn module.
Let’s see how we can use the library to apply z-score scaling to a Pandas Dataframe:
from sklearn.preprocessing import StandardScaler

scaler = StandardScaler()
scaler.fit(df)
scaled = scaler.fit_transform(df)

scaled_df = pd.DataFrame(scaled, columns=df.columns)

print(scaled_df)

# Returns:
#         Age    Height    Weight
# 0 -1.372269 -1.233255 -1.495353
# 1 -0.396061  0.522566  0.991967
# 2 -0.435110 -0.318765  1.406520
# 3 -0.864641 -1.123516 -0.044416
# 4  0.970629  1.144419 -0.251693
# 5  0.384905 -0.501663 -1.184438
# 6  1.712547  1.510215  0.577414
Let’s break down what we’ve done above:
- We instantiated a
StandardScalerclass and fitted the dataframe to it - We then used the
.fit_transform()method to scale the dataframe itself - Finally, we recreated a dataframe out of the data, with the data z-score standardized
Conclusion
In this tutorial, you learned three methods of standardizing or normalizing data in Pandas, using either Pandas or sklearn. You learned how to apply the maximum absolute scaling method, the min-max feature scaling method, and the z-score standardization method.
To learn more about sklearn’s min-max normalization method, check out the official documentation found here.