In this tutorial, you’ll learn how all you need to know about the K-Nearest Neighbor algorithm and how it works using Scikit-Learn in Python. The K-Nearest Neighbor algorithm in this tutorial will focus on classification problems, though many of the principles will work for regression as well.
The tutorial assumes no prior knowledge of the K-Nearest Neighbor (or KNN) algorithm. By the end of this tutorial, you’ll have learned:
- How the algorithm works to predict classes of data
- How the algorithm can be tweaked to use different types of distances
- How the algorithm works with multiple dimensions
- How to work with categorical or non-numeric data in KNN classification
- How to validate your algorithm and test its effectiveness
- How to improve your algorithm using hyper-parameter turning in Python
Let’s get started!
Table of Contents
What is the K-Nearest Neighbor Algorithm?
The K-Nearest Neighbor Algorithm (or KNN) is a popular supervised machine learning algorithm that can solve both classification and regression problems. The algorithm is quite intuitive and uses distance measures to find k closest neighbours to a new, unlabelled data point to make a prediction. Because of this, the name refers to finding the k nearest neighbors to make a prediction for unknown data.
- In classification problems, the KNN algorithm will attempt to infer a new data point’s class by looking at the classes of the majority of its k neighbours. For example, if five of a new data point’s neighbors had a class of “Large”, while only two had a class of “Medium”, then the algorithm will predict that the class of the new data point is “Large”.
- In regression problems, the KNN algorithm will predict a new data point’s continuous value by returning the average of the
kneighbours’ values. For example, if the five closest neighbours had values of[100, 105, 95, 100, 110], then the algorithm would return a value of102, which is the average of those five values.
In an upcoming section, we’ll walk through step-by-step how this algorithm works.
Why is the K-Nearest Neighbor Algorithm a Good Algorithm to Learn?
The K-Nearest Neighbor Algorithm is a great machine learning algorithm for beginners to learn. This isn’t to discount the immense value that a machine learning practitioner can get from the algorithm.
Let’s look at three reasons why the KNN algorithm is great to learn:
- It’s an intuitive algorithm, that is easy to visualize. This makes it great for beginners to learn and easy to explain to non-technical audiences.
- It’s very versatile, since it can be applied to both regression and classification problems.
- The algorithm can work with relatively small datasets and can run quite quickly. It can also be very easily tuned (as you’ll later learn) to improve its accuracy.
Now, let’s dive into how the algorithm actually works!
How does the K-Nearest Neighbor Algorithm Work?
The K-Nearest Neighbor algorithm works by calculating a new data points class (in the case of classification) or value (in the case of regression) by looking at its most similar neighbors. How does it determine which data points are the most similar? Generally, this is done by using a distance calculation, such as the Euclidian distance or the Manhattan distance.
As a machine learning scientist, it’s your job to determine the following:
- Which similarity measure to use,
- How many neighbours (
k) to look at, and - Which features (or dimensions) of your data are most important
Let’s take a look at a sample dataset. Take a look at the data below? Do you see any patterns in the data?
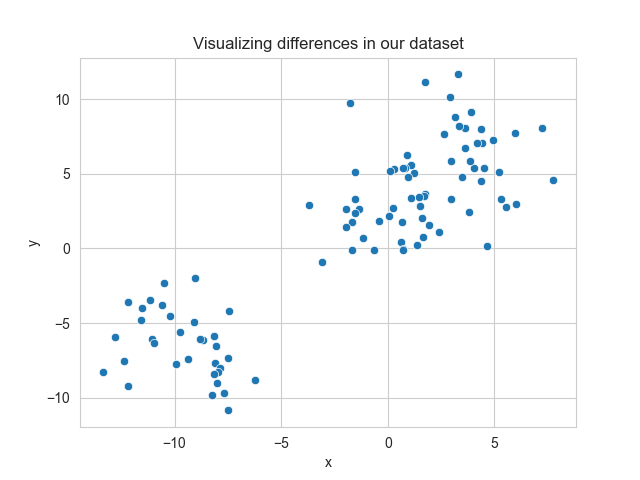
Upon first inspection, it looks like there are two clusters of data. Thankfully, our dataset is pre-labelled and we can actually colour the different labels differently. Let’s take a look at our graph now.
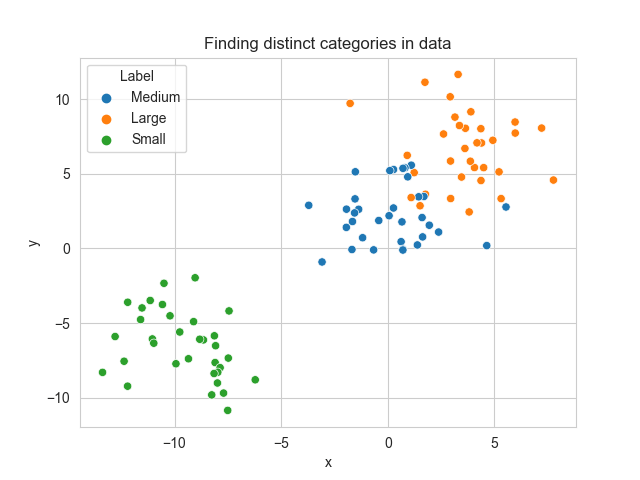
Now we can see there are actually three classes of data. We have “Small”, “Medium”, and “Large” classes of data. We can see that as the values of x and y increase, that the data tends to move closer to a larger class.
Knowing this, let’s introduce a new data point. We don’t know what class the data point belongs to, but we do know its values for x and y, which are stored in the tuple (6, 3).
Let’s see where this new data point fits on our graph:

We can see that our data point is near some Large points (in green) and some Medium points (in orange). It’s a little hard to tell at this point whether our data point should be labelled as Medium or Large?
This is where the KNN algorithm comes into play. Let’s take a look at our first hyper-parameter of the algorithm: k. The value of k determines the number of neighbors to look at. In classification problems, it can be helpful to use odd values of k, since it requires a majority vote (which can be more difficult with an even number).
To start, let’s use the value of k=5, meaning that we’ll look at the new data point’s five closest neighbours. One very useful measure of distance is the Euclidian distance, which represents the shortest distance between two points. Imagine the distance as representing the way a crow would fly between two points, completely unobstructed.
Let’s draw the distances to only the nearest five data points and see which classes are most connected to our new data.

By looking at this, we can see that the majority of the nearest points are classed as Large, with only a single nearest neighbor being classed as Medium.
Using this simple calculation, we’re able to say with some degree of confidence that the label of this data point should be Large.
Later in the tutorial, you’ll learn how to calculate the accuracy of your model, as well as how to improve it.
Using the K-Nearest Neighbor Algorithm in Python’s Scikit-Learn
In this section, you’ll learn how to use the popular Scikit-Learn (sklearn) library to make use of the KNN algorithm. To start, let’s begin by importing some critical libraries: sklearn and pandas:
import pandas as pd
from sklearn.neighbors import KNeighborsClassifier
from seaborn import load_dataset
For this tutorial, we’ll focus on the Penguins dataset that comes bundled with Seaborn. The dataset covers information on different species of penguins, including the island the sample was taken from, as well as their bill length and depth.
The dataset focuses on predicting the species of a penguin based on its physical characteristics. There are three types of Penguins that the dataset has data on: the Adelie, Chinstrap, and Gentoo penguins, as shown below:

We can load the dataset as a Pandas DataFrame to explore the data a bit using the load_dataset() function:
# Loading the penguins dataset
df = load_dataset('penguins')
print(df.head())

# Returns:
#   species     island  bill_length_mm  bill_depth_mm  flipper_length_mm  body_mass_g     sex
# 0  Adelie  Torgersen            39.1           18.7              181.0       3750.0    Male
# 1  Adelie  Torgersen            39.5           17.4              186.0       3800.0  Female
# 2  Adelie  Torgersen            40.3           18.0              195.0       3250.0  Female
# 3  Adelie  Torgersen             NaN            NaN                NaN          NaN     NaN
# 4  Adelie  Torgersen            36.7           19.3              193.0       3450.0  Female
We can see that our dataset has six features and one target. Let’s break this down a little bit:
| Column | Type | Description | Data Type | # of Unique Observations |
|---|---|---|---|---|
| species | Target | The species of the penguin | String | 3 |
| island | Feature | The island on which the penguin’s data was taken | String | 3 |
| bill_length_mm | Feature | The length of the penguin’s bill, measured in millimetres | Float | N/A (continuous) |
| bill_depth_mm | Feature | The depth of the penguin’s bill, measured in millimetres | Float | N/A (continuous) |
| flipper_length_mm | Feature | The length of the penguin’s flipper, measured in millimetres | Float | N/A (continuous) |
| body_mass_g | Feature | The mass of the penguin, measured in grams | Float | N/A (continuous) |
| sex | Feature | The sex of the penguin | String | 2 |
We can see how the measurement’s of the penguins are taken by taking a look at this helpful image below:

Splitting our Data into Training and Testing Data
We’ll need to split our data into both features and target arrays.
- The features array, commonly referred to as
X, is expected to be multi-dimensional array. - Meanwhile, the target array, commonly noted as
y, is expected to be of a single dimension.
Lets focus only one a single dimension for now: bill length. We’ll extract that column as a DataFrame (rather than as a Series), so that sklearn can load it properly.
# Splitting our DataFrame into features and target
df = df.dropna()

X = df[['bill_length_mm']]
y = df['species']
One important piece to note above is that we’ve dropped any missing records. Technically it may be a good idea to try and impute these values. However, this is a bit out of the scope of this tutorial.
We can also split our data into training and testing data to prevent overfitting our analysis and to help evaluate the accuracy of our model. This can be done using the train_test_split() function in sklearn. To learn more about this function, check out my in-depth tutorial here.
For this, we’ll need to import the function first. We’ll then set a random_state= value so that our results are reproducible. This, of course, is optional. However, it lets you reproduce your results consistently, so it’s a good practice.
# Splitting data into training and testing data
from sklearn.model_selection import train_test_split

X_train, X_test, y_train, y_test = train_test_split(X, y, random_state = 100)
Now that we have our dataset lined up, let’s take a look at how the KNeighborsClassifier class works in sklearn.
Understanding KNeighborsClassifier in Sklearn
Before diving further into using sklearn to calculate the KNN algorithm, let’s take a look at the KNeighborsClasifier class:
KNeighborsClassifier(
    n_neighbors=5,          # The number of neighbours to consider
    weights='uniform',      # How to weight distances
    algorithm='auto',       # Algorithm to compute the neighbours
    leaf_size=30,           # The leaf size to speed up searches
    p=2,                    # The power parameter for the Minkowski metric
    metric='minkowski',     # The type of distance to use
    metric_params=None,     # Keyword arguments for the metric function
    n_jobs=None             # How many parallel jobs to run
)
In this tutorial, we’ll focus (in time) on the n_neighbors=, weights=, p=, and n_jobs= parameters.
To kick things off though, let’s focus on what we’ve learned so far: measuring distances using the Euclidian distance, and finding the five nearest neighbors.
In order to use the Euclidian distance, we can either modify the metric= parameter to 'euclidian', or we can change the p= parameter to 1. We’ll get more into this in a later section, but for now, let’s simply change the p= value.
Conventionally, the classifier object is assigned to a variable clf. Let’s load the class with the parameters discussed above:
# Creating a classifier object in sklearn
clf = KNeighborsClassifier(p=1)
In the object above, we’ve instantiated a classifier object that uses the Euclidian distance (p=1) and looks for five neighbours (default n_neighbors=5).
Now that we have our classifier set up, we can pass in our training data to fit the algorithm. This will handle the steps we visually undertook earlier in the tutorial by finding the nearest neighbours’s class for each penguin:
# Fitting our model
clf.fit(X_train, y_train)
At this point, we’ve made our algorithm! Sklearn has abstracted a lot of the complexities of the calculation behind the scenes.
We can now use our model to make predictions on the data. To do this, we can use the .predict() method and pass in our testing feature:
# Making predictions
predictions = clf.predict(X_test)
print(predictions)

# Returns:
# ['Adelie' 'Gentoo' 'Chinstrap' 'Adelie' 'Gentoo' 'Gentoo' 'Gentoo'
#  'Chinstrap' 'Gentoo' 'Gentoo' 'Gentoo' 'Adelie' 'Adelie' 'Gentoo'
#  'Gentoo' 'Chinstrap' 'Chinstrap' 'Adelie' 'Gentoo' 'Gentoo' 'Adelie'
#  'Gentoo' 'Adelie' 'Adelie' 'Adelie' 'Adelie' 'Gentoo' 'Chinstrap'
#  'Adelie' 'Adelie' 'Adelie' 'Adelie' 'Gentoo' 'Adelie' 'Chinstrap'
#  'Gentoo' 'Adelie' 'Gentoo' 'Gentoo' 'Gentoo' 'Adelie' 'Gentoo' 'Adelie'
#  'Adelie' 'Chinstrap' 'Chinstrap' 'Chinstrap' 'Adelie' 'Gentoo' 'Gentoo'
#  'Gentoo' 'Gentoo' 'Adelie' 'Adelie' 'Gentoo' 'Gentoo' 'Adelie' 'Gentoo'
#  'Gentoo' 'Adelie' 'Gentoo' 'Gentoo' 'Gentoo' 'Adelie' 'Adelie' 'Adelie'
#  'Chinstrap' 'Adelie' 'Gentoo' 'Gentoo' 'Chinstrap' 'Chinstrap' 'Adelie'
#  'Chinstrap' 'Gentoo' 'Gentoo' 'Gentoo' 'Chinstrap' 'Adelie' 'Gentoo'
#  'Adelie' 'Adelie' 'Adelie' 'Chinstrap']
Similarly, if we wanted to simply pass in a single mock-penguins data, we could pass in a list containing that one value. Say we measured our own pet penguin’s bill length and found that it was 45.2 mm. We could simply write:
# Making your own predictions
predictions = clf.predict([[44.2]])
print(predictions)

# Returns
# 'Gentoo'
At this point, you may be wondering: “Great! We’ve made a prediction. But, how accurate is that prediction?” Let’s dive into the next section to learn more about evaluating our model’s performance.
Validating a K-Nearest Neighbor Algorithm in Python’s Scikit-Learn
At this point, you’ve created a K-Nearest Neighbor classifier using a single feature. You’re probably also curious to know how accurate your model is. We can measure the model’s accuracy because our original dataset was pre-labelled.
Because we split our data into training and testing data, it can be helpful to evaluate the model’s performance using the testing data. This is because this is data that the model hasn’t yet seen. Because of this, we can be confident that the model’s effectiveness to new data can be accurately tested.
In classification problems, one helpful measurement for a model’s effectiveness is the accuracy score. This looks at the proportion of accurate predictions out of the total of all predictions.
When we made predictions using the X_test array, sklearn returned an array of predictions. We already know the true values for these: they’re stored in y_test.
We can use the sklearn function, accuracy_score() to return a proportion out of 1 that measures the algorithms effectiveness. Let’s see how we can do this:
# Measuring the accuracy of our model
from sklearn.metrics import accuracy_score
print(accuracy_score(y_test, predictions))

# Returns: 0.7023809523809523
We can see that the model’s accuracy is 70%, meaning that it returned true positives 7/10 times. This isn’t bad, but we can definitely tweak our algorithm to improve its effectiveness. In order to do this, let’s take a quick look at how else we can measure distances using a K-Nearest Neighbor algorithm.
How Do You Calculate Distances in K-Nearest Neighbor?
So far in this tutorial, we’ve explored how to measure the distance between two points using the Euclidian distance. Another distance metric that can be used is the Manhattan distance, which is often referred to as the tax-cab distance. While the Euclidian distance measures the shortest distance between two points, the Manhattan distance measures the distance that a taxi-cab would have to take if it could only make right-angle turns.
Take a look at the image below to see how these distances differ:

When the metric= parameter was first introduced, the default value was specified to 'minkowski'. The Minkowski distance is the generalization of both the Euclidian distance and the Manhattan distance.
Let’s take a look at the formula:

When p is equal to 2, the distance represents the Euclidian distance. When p is equal to 1, the Minkowski distance represents the Manhattan distance.
Because of this, we can toggle between the two distances by setting the values of p to either 1 or 2. Later on in the tutorial, you’ll learn to test which of the distances is a better for the context of your data. Neither is inherently better and will depend on the particulars of your dataset.
When would you use either distance? There is no hard and fast rule. However, the Manhattan distance has been suggested to work better for high-dimensional datasets and when the influence of outliers can have a dramatic effect.
Measuring the Influence of a Neighbours’ Distance
One other piece to consider is how the neighbours themselves are weighted. By default, sklearn will weight each neighbour in a uniform manner. This means that regardless of how far each neighbour is away from the new data point, it will have the same weight.
This is controlled by the weights= parameter. If we wanted to change this to instead weigh each data point based on its distance from the new data point, we could set the argument to 'distance'. In this case, the weight of each neighbour is the inverse of its distance to the data point.
Again, neither of these approaches is inherently right or wrong, or better or worse. This is where the “art” of machine learning comes in, as each hyper-parameter is tuned using the specifics of your dataset.
Using Multiple Dimensions in K-Nearest Neighbor in Python
When we first loaded this dataset, we knew that we had access to seven features. Perhaps our model’s accuracy was only 70% because we used only one feature. Perhaps this feature didn’t have as much influence as we’d have hoped.
In this section, you’ll learn how to build your KNN algorithm using multiple dimensions. We’ll focus on only numeric features so far, but cover off categorical data in the next section. By necessity, sklearn requires that each value passed into the algorithm is numeric and not missing.
Let’s change our X variable to represent all the numeric columns in our dataset. We can accomplish this by using the select_dtypes() function and asking Pandas to only include the type of numbers:
df = load_dataset('penguins')
df = df.dropna()

X = df.select_dtypes(include='number')
y = df['species']
In this case, Pandas included the following columns:
- bill_length_mm
- bill_depth_mm
- flipper_length_mm
- body_mass_g
We now have four dimensions to work with. What’s great about this is that it introduces significantly more data, which will hopefully improve our predictions!
In order to modify our algorithm, we don’t actually need to do anything differently. Let’s repeat the steps from above by first splitting our data and then passing in our training data:
# Loading a multi-dimensional dataset into KNN
X = df.select_dtypes(include='number')
y = df['species']

X_train, X_test, y_train, y_test = train_test_split(X, y, random_state = 100)

clf = KNeighborsClassifier(p=1)
clf.fit(X_train, y_train)
predictions = clf.predict(X_test)
Let’s see how much our accuracy score changed in this case:
# Checking our new accuracy score
print(accuracy_score(y_test, predictions))

# Returns: 0.7738095238095238
We can see that our model’s accuracy improved by 7%! Let’s take a look at how we can encode our categorical data to make it work with our algorithm.
Working with Categorical Data in K-Nearest Neighbor in Python
Machine learning models work with numerical data. Because of this, we need to transform the data in our categorical columns into numbers in order for our algorithm to work successfully.
There are a number of different ways in which we can encode our categorical data. One of these methods is known as one-hot encoding. This process converts each unique value in a categorical column into its own binary column. The image below demonstrates how this can be done:
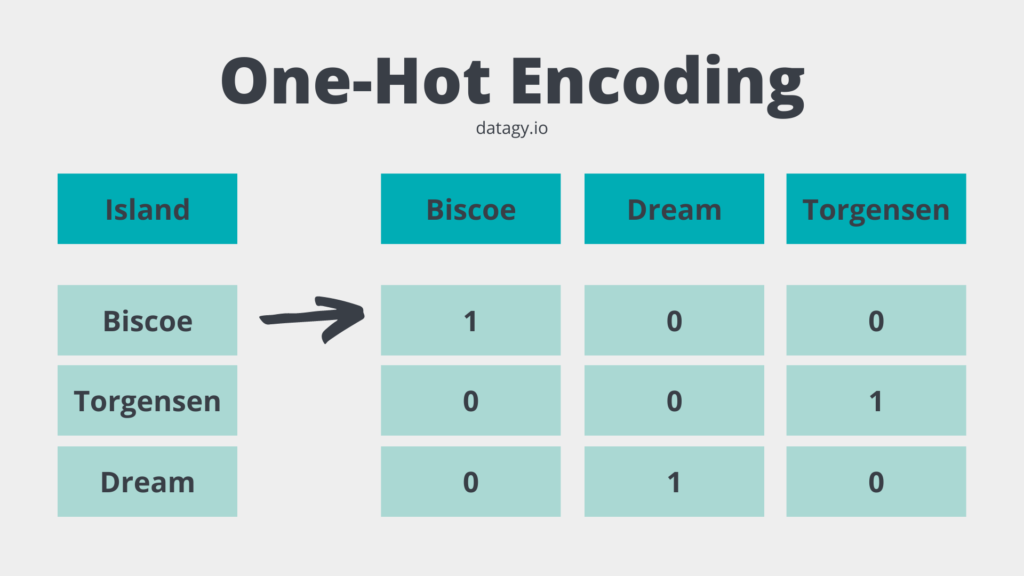
In the image above, each unique value is turned into its own column. This means that for the three unique values we now have three distinct column. The values represent either a 1 (for that value being represented) or a 0 (for the value not being represented).
You may be wondering why we didn’t encode the data as 0, 1, and 2. The reason for this is because the data isn’t ordinal or interval data, where the order means anything. By assigning a value of 0 to one island and 2 to another would imply the difference between these two islands is greater than between one island and another.
Let’s see how we can one-hot encode the two categorical columns, 'sex' and 'island':
# One-hot encoding categorical variables in Sklearn
from sklearn.preprocessing import OneHotEncoder
from sklearn.compose import make_column_transformer

X = df.drop(columns = ['species'])

X_train, X_test, y_train, y_test = train_test_split(X, y, random_state = 100)

column_transformer = make_column_transformer(
    (OneHotEncoder(), ['sex', 'island']),
    remainder='passthrough')

X_train = column_transformer.fit_transform(X_train)
X_train = pd.DataFrame(data=X_train, columns=column_transformer.get_feature_names())
Let’s break down what we did here:
- We imported both the OneHotEncoder class and the make_column_transformer class
- We created a make_column_transformer class and passed in a tuple containing the transformation we wanted to happen. We wanted to apply a OneHotEncoder() class with default arguments to both the
'sex'and'island'columns. The argument ofremainder = 'passthrough'simply instructs sklearn to ignore the other columns. - We used the
.fit_transform()method to transformX_train - Finally, we created a new DataFrame out of the transformed data.
Scaling Data for K-Neatest Neighbor
One of the things you may have noticed in our DataFrame is that some of our features have significantly larger ranges than others. For example, all of our one-hot encoded variables have either a 0 or a 1. However, our body_mass_g variable has a range of 2700 through 6300.
One of the things that may occur is that the variables with larger ranges dominate the algorithm. This can be mitigated if we scale the data. By using a Min-Max normalization method, all the values will exist on a range from 0 to 1, though the original distribution of the data will be maintained.
Let’s see how we can use sklearn to apply Min-Max scaling to our data. Because we’re applying a transformation to our columns, we can actually build this into the make_column_transformer class from earlier! This will save us a bit of trouble to fit and transform two sets of data.
# Adding Min-max Scaling to our Preprocessing
import pandas as pd
from sklearn.neighbors import KNeighborsClassifier
from sklearn.model_selection import train_test_split
from sklearn.preprocessing import OneHotEncoder
from sklearn.compose import make_column_transformer
from sklearn.metrics import accuracy_score
from sklearn.preprocessing import MinMaxScaler
from seaborn import load_dataset

df = load_dataset('penguins')
df = df.dropna()

X = df.drop(columns = ['species'])
y = df['species']

X_train, X_test, y_train, y_test = train_test_split(X, y, random_state = 100)

column_transformer = make_column_transformer(
    (OneHotEncoder(), ['sex', 'island']),
    (MinMaxScaler(), ['bill_depth_mm', 'bill_length_mm', 'flipper_length_mm', 'body_mass_g']),
    remainder='passthrough')

X_train = column_transformer.fit_transform(X_train)
X_train = pd.DataFrame(data=X_train, columns=column_transformer.get_feature_names())
Now that we’ve preprocessed our data both by one-hot encoding and scaling our data, let’s take a look at how the accuracy has changed.
We’ll need to apply the fitted transformations of our data to the testing data, so there’ll be a bit of pre-work to do before we can make predictions.
# Making predictions with our new algorithm
X_test = column_transformer.transform(X_test)
X_test = pd.DataFrame(data=X_test, columns=column_transformer.get_feature_names())

clf = KNeighborsClassifier(p=1)
clf.fit(X_train, y_train)
predictions = clf.predict(X_test)

print(accuracy_score(y_test, predictions))

# Returns: 1.0
Let’s break down what we did above:
- We used our column_transformer to transform the testing features in the same way as our training data. Note, in particular, we’re using only the
.transform()method – not the.train_transform()method we previously used. - We used our training data to train our classifier and passed in our transformed training data to make predictions.
- Finally, we used our testing labels to test our accuracy
Note that the accuracy we returned was 100%! This may have been a fluke based on the random state that we used. Changing the random state will result in slightly lower accuracy (though still in the high 90%s).
It’s important to note that accuracy is just a single criterion for evaluating the performance of a classification problem. If you want to learn more about this, check out my in-depth post on calculating and visualizing a confusion matrix in Python.
Hyper-Parameter Tuning for K-Nearest Neighbor in Python’s Scikit-Learn
To close out this tutorial, let’s take a look at how we can improve our model’s accuracy by tuning some of its hyper-parameters. Hyper-parameters are the variables that you specify while building a machine learning model. This includes, for example, the number of neighbours to consider or the type of distance to use.
Hyper-parameter tuning, then, refers to the process of tuning these values to ensure a higher accuracy score. One way to do this is, simply, to plug in different values and see which hyper-parameters return the highest score.
This, however, is quite time-consuming. Scikit-Learn comes with a class GridSearchCV which makes the process simpler. You simply provide a dictionary of values to run through and sklearn returns the values that worked best.
What’s more, is that the class also completes a process of cross-validation. When we picked our random-state, we trained based on a single selection of training data. GridSearchCV will cycle through the different combinations of training and testing splits that can be created.
Want to learn about a more efficient way to optimize hyperparameters? You can optimize and speed up your hyperparameter tuning using the Optuna library.
Let’s consider some of the hyper-parameters that we may want to tune to improve the accuracy of our KNN model:
n_neighborsmeasures the number of neighbours to use to determine what classification to make. Since we’re working in classification and need a majority vote, it can be helpful to consider only odd numbers.pdetermines what type of distance to use. We can test both Euclidian and Manhattan distances.weightsdetermines whether to weigh all neighbours equally or to take their distances into consideration.
Let’s pass in a dictionary of these parameters into our GridSearchCV class:
# Creating a dictionary of parameters to use in GridSearchCV
from sklearn.model_selection import GridSearchCV

params = {
    'n_neighbors':  range(1, 15, 2),
    'p': [1,2],
    'weights': ['uniform', 'distance']
}

clf = GridSearchCV(
    estimator=KNeighborsClassifier(),
    param_grid=params,
    cv=5,
    n_jobs=5,
    verbose=1,
)

clf.fit(X_train, y_train)
print(clf.best_params_)

# Returns: {'n_neighbors': 5, 'p': 1, 'weights': 'uniform'}
Let’s break this code down a bit:
- We defined a dictionary of parameters to test.
- We created a classifier using the GridSearchCV class, asking for a cross-validation of 5
- Finally, we fitted the data and printed the best values for our hyper-parameters.
In this case, sklearn returned the values of {'n_neighbors': 5, 'p': 1, 'weights': 'uniform'} for our best parameters. Note that this is only the best parameters of the options we asked to be tested. It could very well be that the value for n_neighbors=21 would have produced the best results – but we didn’t ask sklearn to test that!
Now that you have these parameters, simply pass them into your model.
What to Learn After This Tutorial
Ok! You’ve made it to the end of the tutorial. At this point, you may be thinking, “Ok Nik – what now?” The answer to that question is simply to play around with this model and see if you can make it work with other datasets! Try and learn about different parameters in the KNeighborsClassifier class and see how you can tweak them to make your model run better or more efficiently.
Take a look at the sklearn documentation for the KNeighborsClassifier. While it can often seem dense, hopefully this tutorial makes them a little clearer.
Conclusion
In this tutorial, you learned how to use the KNeighborsClassifier to take on the K-Nearest Neighbors classifier algorithm in sklearn. You first learned why the algorithm is a good choice, especially for beginners or for those who need to explain what’s going on. You then learned, visually, how the algorithm works. Then you walked through an end-to-end exercise of preparing your data for the algorithm, evaluating its performance, and tweaking it to make it perform better.
Additional Resources
To learn more about related topics, check out the articles below:
Hi,
Your coding content is very useful . But due to heavy ads, site is very slow and boring. Can you publish some plotting technique using matplotlib library?
Thanks Bruce! I appreciate the feedback. I’m definitely planning on adding more on Matplotlin the future.