In this tutorial, you’ll learn how to use Python to calculate the MAPE, or the mean absolute percentage error. This error is often used to measure the accuracy of machine learning models.
By the end of this tutorial, you’ll have learned:
- What the Mean Absolute Percentage Error is
- What a good value for the MAPE is
- How to calculate the MAPE in Python
- What some common cautions are with the MAPE
Let’s get started!
Table of Contents
What is the Mean Absolute Percentage Error?
The Mean Absolute Percentage Error (MAPE) can be used in machine learning to measure the accuracy of a model. More specifically, the MAPE is a loss function that defines the error of a given model.
The MAPE is calculated by finding the absolute difference between the actual and predicted values, divided by the actual value. These ratios are added for all values and the mean is taken.
More concisely, the formula for the MAPE is:
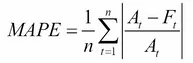
In the formula above:
Σindicates to add all the resulting valuesnis the sample sizeAis the actual valueFis the predicted value
Should the MAPE be High or Low?
The MAPE is a commonly used measure in machine learning because of how easy it is to interpret. The lower the value for MAPE, the better the machine learning model is at predicting values. Inversely, the higher the value for MAPE, the worse the model is at predicting values.
For example, if we calculate a MAPE value of 20% for a given machine learning model, then the average difference between the predicted value and the actual value is 20%.
As a percentage, the error measurement is more intuitive to understand than other measures such as the mean square error. This is because many other error measurements are relative to the range of values. This requires you to jump through some additional mental hurdles to determine the scope of the error.
What is a Good MAPE Score?
The MAPE returns a percentage, which can make it intuitive to understand. Because the percentage reflects the average percentage error, the lower the score the better.
Below, you’ll find some general guidelines on what a good MAPE score is:
| MAPE Score | Interpretation of Score |
|---|---|
| > 50 % | Poor |
| 20% – 50% | Relatively good |
| 10% – 20% | Good |
| < 10% | Great |
A MAPE score, like anything else in machine learning, should not be taken at face value. Keep in mind the range of your data (as lower ranges will amplify the MAPE) and the type of data you’re working with.
As you’ll learn in a later section, the MAPE does have some problems with some data, especially lower volume data. Because of this, make sure you have a good sense of how your data is structured before making decisions using MAPE alone.
Use Python to Calculate the MAPE Score from Scratch
It’s very simple to create a function for the MAPE using the built-in numpy library.
Let’s see how we can do this:
# Creating a Function for MAPE
import numpy as np

def mape(y_test, pred):
    y_test, pred = np.array(y_test), np.array(pred)
    mape = np.mean(np.abs((y_test - pred) / y_test))
    return mape
Let’s break down what we did here:
- We imported numpy to simplify array operations
- We defined a function,
mape, that takes two arrays: the testing array and the predicted array - Both these arrays are converted into numpy arrays
- The MAPE is calculated using the formula above
Let’s run through a very simple machine learning example using a linear regression model in Scikit-Learn:
# A practical example of MAPE in machine learning
import numpy as np
from sklearn.datasets import load_diabetes
from sklearn.model_selection import train_test_split
from sklearn.linear_model import LinearRegression

def mape(y_test, pred):
    y_test, pred = np.array(y_test), np.array(pred)
    mape = np.mean(np.abs((y_test - pred) / y_test))
    return mape

data = load_diabetes()
X, y = data.data, data.target
X_train, X_test, y_train, y_test = train_test_split(X, y)

lnr = LinearRegression()
lnr.fit(X_train, y_train)
predictions = lnr.predict(X_test)

print(mape(y_test, predictions))

# Returns: 0.339
In the example above, we created a simple machine learning model. The model predicted some values – these were stored in the predictions variable.
We tested the accuracy of our model by passing in our predictions and the actual values, y_test into our function, mape(). This returned a value of 0.339, which is equal to 33.9%.
Calculating the MAPE Using Sklearn
Scikit-Learn also comes with a function for the MAPE built-in, the mean_absolute_percentage_error() function from the metrics module.
Like our function above, the function takes the true values and the predicted values as input:
# Using the mean_absolute_percentage_error function
from sklearn.metrics import mean_absolute_percentage_error

error = mean_absolute_percentage_error(y_true, predictions)
Let’s recreate our earlier example using this function:
# A practical example of MAPE in sklearn
from sklearn.datasets import load_diabetes
from sklearn.model_selection import train_test_split
from sklearn.linear_model import LinearRegression
from sklearn.metrics import mean_absolute_percentage_error

data = load_diabetes()
X, y = data.data, data.target
X_train, X_test, y_train, y_test = train_test_split(X, y)

lnr = LinearRegression()
lnr.fit(X_train, y_train)
predictions = lnr.predict(X_test)

print(mean_absolute_percentage_error(y_test, predictions))

# Returns: 0.339
In the next section, you’ll learn about some common problems with the MAPE score.
Common Problems with the MAPE score
While the MAPE is easy to understand, this simplicity can also lead to some problems. One of the major problems with the MAPE score is how easily it is influenced by values of a low range.
For example, a predicted value of 3 and a true value of 2 indicate an error of 50%. Meanwhile, the data are only 1 off. If the real value was 100 and the predicted value was 101, then the error would only be 1%.
This is where the matter of interpretation comes in. In the example above, a difference between the values of 2 and 3 may be insignificant (in which case the MAPE is a poor metric). However, the difference may actually be incredibly meaningful, in which case the MAPE is a good metric.
Keep in mind the context of your data when interpreting the score.
Conclusion
In this tutorial, you learned how to use Python to calculate the MAPE score. You learned what the MAPE score is and how to interpret it. You also learned how to calculate the score from scratch, as well as how to use a sklearn function to calculate the mean absolute percentage error.
Additional Resources
To learn more about related topics, check out the tutorials below: