In this tutorial, you’ll learn about Support Vector Machines (or SVM) and how they are implemented in Python using Sklearn. The support vector machine algorithm is a supervised machine learning algorithm that is often used for classification problems, though it can also be applied to regression problems.
This tutorial assumes no prior knowledge of the support vector machines algorithm. By the end of this tutorial, you’ll have learned:
- How the SVM algorithm was designed and how to understand it conceptually
- How the SVM algorithm is used to make predictions of classes
- How the algorithm handles multiple dimensions
- How the kernel trick makes the SVM algorithm a practical algorithm
- How to validate your algorithm’s effectiveness and accuracy
- How the algortihm can be tweaked using hyper-parameter tuning
Table of Contents
What are Support Vector Machines in Machine Learning?
Support vector machines (or SVM, for short) are algorithms commonly used for supervised machine learning models. A key benefit they offer over other classification algorithms (such as the k-Nearest Neighbor algorithm) is the high degree of accuracy they provide.
Conceptually, SVMs are simple to understand. This tutorial will guide you through SVMs in increasing complexity to help you fully grasp the concepts behind them.
In short, support vector machines separate data into different classes of data by using a hyperplane. This hyper-plane, as you’ll soon learn, is supported by the use of support vectors. These vectors are used to ensure that the margin of the hyper-plane is as large as possible.
Why is the SVM Algorithm Useful to Learn?
The Support Vector Machines algorithm is a great algorithm to learn. It offers many unique benefits, including high degrees of accuracy in classification problems. The algorithm can also be applied to many different use cases, including facial detection, classification of websites or emails, and handwriting recognition.
However, a key benefit of the algorithm is that it is intuitive. Being able to understand the mechanics behind an algorithm is important. This is true even when the math is a bit out of scope.
Additionally, the algorithm works especially well with high-dimensional datasets. This makes it particularly useful, especially compared to other algorithms that may struggle under significant dimensionality.
In this tutorial, we’ll focus on learning the mechanics and motivations behind the algorithm, rather than focusing on the math. This is because much of the math is abstracted by machine learning libraries such as Scikit-Learn.
How Does the Support Vector Machine Algorithm Work?
In this section, we’ll explore the mechanics and motivations behind the support vector machines algorithm. We’ll start with quite straightforward examples and work our way up to more complex uses of the algorithm.
As mentioned earlier in the tutorial, the SVM algorithm aims to find the optional hyper-plane that separates classes of data. But, what is a hyper-plane? A hyper-plane is a decision boundary (such as a point, a line, or a plane) that separates classes of data.
Let’s first look at data that are linearly separatable, which is one of the simplest applications of the support vector machines algorithm.
Support Vector Machines with Linearly Separatable Data
Data that are linearly separable means that we can separate the data into distinct classes using a linear model, such as a line.
To better illustrate this, as well as how the SVM algorithm works, let’s take a look at some data. We’ll plot two-dimensional data along the x and y axis.
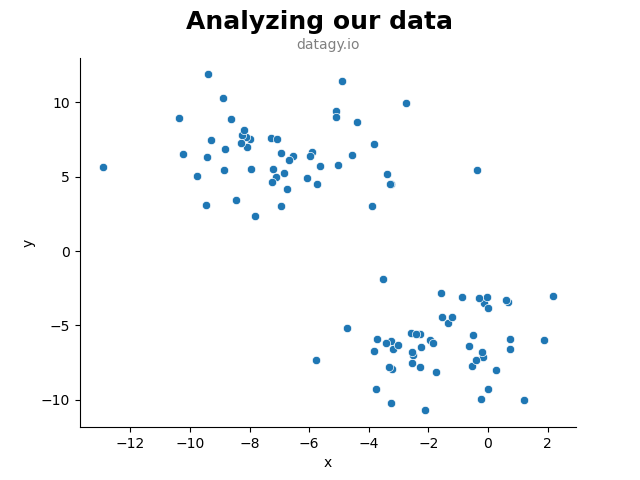
In the scatter plot above we visualized our data along two dimensions. Visually, it’s quite clear that we have two distinct clusters of data. Thankfully, our data came pre-labeled and we can map in these target features into our visualization!
Let’s see what this looks like this classes mapped into it:

Awesome! We can see that we have two clusters: those belonging to 'No' and those belonging to 'Yes'. The support vector machines algorithm seeks to separate these two clusters of data by using a hyper-plane. In this case, our hyper-plane would be a line that splits the data into two.
Let’s see how we can draw a few lines that all separate the data perfectly:

All of the lines above separate the data perfectly. So, how do we choose a single line to use as our algorithm’s hyperplane? The idea behind choosing the line is the one that best separates the data. SVM algorithms do this process iteratively. They will try a line, then another, and another, until they find the best one. In this case, the best line is the one shown below:

Why is this the best hyperplane to use? In short, this line maximizes the margins between the line and the closest data points. The margins are the gaps between the line and the nearest data points of either class.
This gap is measured as the perpendicular distance between the hyperplane and the data point. In practice, the larger the margin better, and a smaller margin is worse.
Let’s visualize what these margins look like, based on the line that we’ve drawn above:

We can see that we have drawn two margins here. Intuitively, we can imagine that the margins of this line are larger than the margins of the other lines would have been.
If you look closely, you’ll notice that the two margins actually touch some of the data points of both classes. Let’s take a closer look at these:

These points have a special purpose in SVM algorithms. They are known as the support vectors of our model. They’re called support vectors because they’re the data points that define the boundary that divides our two classes of data.
In fact, they’re the only points that influence the data, as the data currently stands. Adding additional points on either side of the margin (as long as they’re classified properly) has no impact on the hyperplane of the supporting margins.
In a later section, you’ll learn how to build these SVM models in Scikit-Learn. In the next section, however, you’ll learn some additional mechanics behind the SVM algorithm.
Transforming Data to Produce Linearly Seperatable Data
In this section, we’ll dive into some more complex data. In particular, we’ll take a look at how we can transform data using some simple transformations to make the data linearly separatable.
To better understand this, let’s take a look at an example of one-dimensional data.

In the example above, we have three clusters, but only two labels. There’s no straight line that can effectively split the data appropriately. So, what can we do? One of the things things that SVM does particularly well is transform the data in order to allow a hyperplane to separate the data.
Let’s try raising each value of x to the power of 4. This adds a second dimension, where we can plot the values as (xi, xi4). Let’s see what this looks like:

We can see that the data are now able to be separated by a straight line. Let’s draw a hyperplane to separate the data to be used to classify:

Ok, so we’ve taken a look at two examples. For our final example, let’s look at a different, yet common scenario: data that form clustered circles.
Transforming Non-Linear With Inseperable Planes
In this final example, we’ll take a look at how we can best transform data which no amount of linear transformation can make separable. In this case, we’ll look at data that’s in the shape of clustered circles.
Take a look at the graph below. It’s clear that we certainly cannot fit a line to separate this data.

One thing we can do is apply the kernel trick to transform the data into a higher dimension.
The kernel trick is powerful because it allows us to operate in the original vector space without needing to compute the coordinates of data in a higher dimensional space. In short, it allows us to find the optimal function to apply, without needing to formally apply it.
Let’s take a look at how we could, for example, transfer for the data above to a different dimension in order to find an appropriate hyperplane.
One thing you might note is that the inner circle is centred around the origin. By transforming these values to a higher dimension, these values will remain lower.
Let’s find the negative sum of the squares of the coordinates for each of these values and have that equal the third dimension of the data. Doing this results in the following visualization:

We can now easily see that we can in fact separate the data. However, because we’re now working in three dimension, our hyperplane becomes a plane that separates the two classes.
Now that you understand the motivations and mechanics of support vector machines, let’s see how we can implement them using the Python Scikit-Learn library!
Support Vector Machines in Python’s Scikit-Learn
In this section, you’ll learn how to use Scikit-Learn in Python to build your own support vector machine model. In order to create support vector machine classifiers in sklearn, we can use the SVC class as part of the svm module.
Let’s begin by importing the required libraries for this tutorial:
# Importing required libraries
from seaborn import load_dataset, pairplot
import matplotlib.pyplot as plt
import pandas as pd
from sklearn.svm import SVC
from sklearn.model_selection import train_test_split
from sklearn.metrics import accuracy_score
Let’s break down the libraries that we’re using in this tutorial:
- The seaborn library is used to provide the dataset we’ll be using throughout this tutorial – the
'penguins'dataset. We’ll also use thepairplot()function to better understand our data. matplotlib.pyplotto show and modify our visualizations- Pandas is used to manipulate our data via DataFrame methods
- The
SVCclass is used to create our classification model - The
train_test_split()function is used to split our data into training and testing data - The
accuracy_score()function allows us to evaluate the performance of our model
For this tutorial, we’ll focus on the Penguins dataset that comes bundled with Seaborn. The dataset covers information on different species of penguins, including the island the sample was taken from, as well as their bill length and depth.
The dataset focuses on predicting the species of a penguin based on its physical characteristics. There are three types of Penguins that the dataset has data on: the Adelie, Chinstrap, and Gentoo penguins, as shown below:

Let’s begin by first loading our dataset and exploring it a little bit:
# Loading and exploring our dataset
df = load_dataset('penguins')
print(df.head())

# Returns:
#   species     island  bill_length_mm  bill_depth_mm  flipper_length_mm  body_mass_g     sex
# 0  Adelie  Torgersen            39.1           18.7              181.0       3750.0    Male
# 1  Adelie  Torgersen            39.5           17.4              186.0       3800.0  Female
# 2  Adelie  Torgersen            40.3           18.0              195.0       3250.0  Female
# 3  Adelie  Torgersen             NaN            NaN                NaN          NaN     NaN
# 4  Adelie  Torgersen            36.7           19.3              193.0       3450.0  Female
In the data shown above, we can see that we have a mix of numerical and categorical columns. In the process of this tutorial, we’ll use all the features to predict the 'species' column.
To better understand what some of these measurements represent, take a look at the image below:

We can see that we also have a number of missing values. While we could impute this data, it’s a little outside of the scope of this tutorial. Since machine learning algorithms cannot work with missing data, let’s drop these records.
# Dropping missing records
df = df.dropna()
print(len(df))
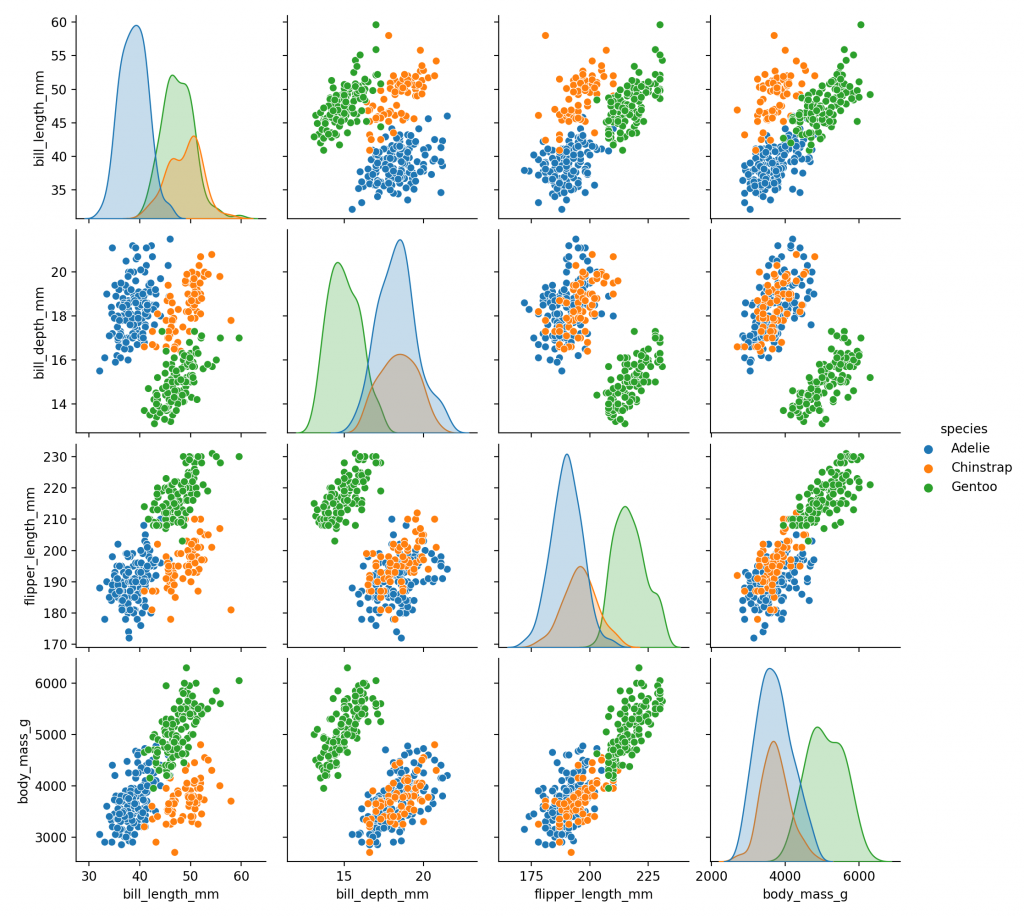
# Returns: 333Now, let’s explore the numeric features of this data a little bit to see what how the data is spread out. For this, we can use the Seaborn pairplot() function to visualize the data by its pairs of features:
# Plotting our penguin species features
pairplot(df, hue='species')
plt.show()
This returns the following image:
Multi-Class Classification with SVM with Sklearn
Before diving further into building our model, I want to take a moment to discuss how multi-class classification works in SVM. In all the theory covered above we focused on binary classifiers (either “Yes” or “No”, 0 or 1, etc.). As you can see in the data above, there are three classes.
When facing multiple classes, Sklearn applies a one-to-one approach where it models the hyperplane for each pair of potential options. For example, it would build the classifer for Adelie vs. Chinstrap, ignoring Gentoo. Then it would do that same for Adelie vs. Gentoo, ignoring Chinstrap.
In one-to-one multi-class SVM, the class with the most predicted values is the one that’s predicted.
We can determine the number of models that need to be built by using this formula:
models = (num_classes * (num_classes - 1)) / 2
models = (3 * (3-2)) / 2
models = (3 * 2) / 2
models = 6 / 2
models = 3
We can see that we’ll need to build three models for our classifier to work. Fortunately, Sklearn handles and abstracts all of this!
Splitting our Data into Testing and Training Data
Let’s now split our data into training and testing data. This step is important because it allows us to validate the accuracy of our model against data that the model hasn’t yet seen. For this, we’ll use Sklearn’s train_test_split() function, which I cover in detail here.
To start off with, let’s only look at two numeric variables. We’ll discuss working with categorical data later in the tutorial, but for now let’s ignore those features.
We can follow Sklearn convention and create two different arrays of data:
Xwill be our feature matrix. The letter is capitalized as it is a multi-dimensional array.ywill be our target array. The letter is not capitalized as it is one-dimensional.
Let’s create these variables now and split them using the train_test_split() function:
# Splitting our data
X = df[['bill_length_mm', 'bill_depth_mm']]
y = df['species']

X_train, X_test, y_train, y_test = train_test_split(X, y, random_state=100)
By default, Sklearn will reserve 25% of the dataset for training.
Understanding Support Vector Classifiers (SVC) in Sklearn
In order to handle classifications, Sklearn provides a support vector machines classifier class called SVC. Let’s take a look at the different parameters of the class:
# The SVC Class from Sklearn
sklearn.svm.SVC(*,
    C=1.0,                          # The regularization parameter
    kernel='rbf',                   # The kernel type used
    degree=3,                       # Degree of polynomial function
    gamma='scale',                  # The kernel coefficient
    coef0=0.0,                      # If kernel = 'poly'/'sigmoid'
    shrinking=True,                 # To use shrinking heuristic
    probability=False,              # Enable probability estimates
    tol=0.001,                      # Stopping crierion
    cache_size=200,                 # Size of kernel cache
    class_weight=None,              # The weight of each class
    verbose=False,                  # Enable verbose output
    max_iter=- 1,                   # Hard limit on iterations
    decision_function_shape='ovr',  # One-vs-rest or one-vs-one
    break_ties=False,               # How to handle breaking ties
    random_state=None               # Random state of the model
)
The class has a lot of different parameters. In this tutorial, we’ll focus on only a few of them, but set you up to be able to explore the others confidently. In particular, we’ll focus on:
kernel=, which defines what type of function is used to transform the datasetC=, which defines the regularization of the error.gamma=defines how loosely the model will fit the training data, allowing you to prevent overfitting
Let’s try building our model first with only the default parameters, except using a linear kernel. Once our model has been set up, we can apply the .train() method to train the data using the X_train and y_train variables:
# Building and training our model
clf = SVC(kernel='linear')
clf.fit(X_train, y_train)
We can now use the model to make predictions of the data. We can do this by using the .predict() method and passing in our testing features.
Let’s see what this looks like:
# Making predictions with our data
predictions = clf.predict(X_test)
print(predictions[:5])

# Returns: ['Adelie' 'Chinstrap' 'Adelie' 'Adelie' 'Adelie']
You’ve now built your first SVM classifier and made some predictions based on the data!
One of the wonderful things about Scikit-Learn is how much it abstracts what’s going on with the algorithm. This, however, can also be one of the challenges that comes with learning how this actually works. Before diving further into the algorithm, let’s try and visualize what’s gone on here.
We can write some helper code to help us visualize the distribution of the data and plot the linear model that separates the data. Let’s see what this looks like. In order to make this simpler, let’s limit our algorithm to a binary classification.
# Rerunning the algorithm with a binary classifier
df = load_dataset('penguins')
df = df.dropna()
df = df[df['species'] != 'Gentoo']    # This limits us to two classes

# X = df.select_dtypes('number')
X = df[['bill_length_mm', 'bill_depth_mm']]
y = df['species']

X_train, X_test, y_train, y_test = train_test_split(X, y, random_state=100)

clf = SVC(kernel='linear')
clf.fit(X_train, y_train)

# Visualizing the linear function for our SVM classifier
import numpy as np
from seaborn import scatterplot
w = clf.coef_[0]
b = clf.intercept_[0]
x_visual = np.linspace(32,57)
y_visual = -(w[0] / w[1]) * x_visual - b / w[1]

scatterplot(data = X_train, x='bill_length_mm', y='bill_depth_mm', hue=y_train)
plt.plot(x_visual, y_visual)
plt.show()
This returns the following image:
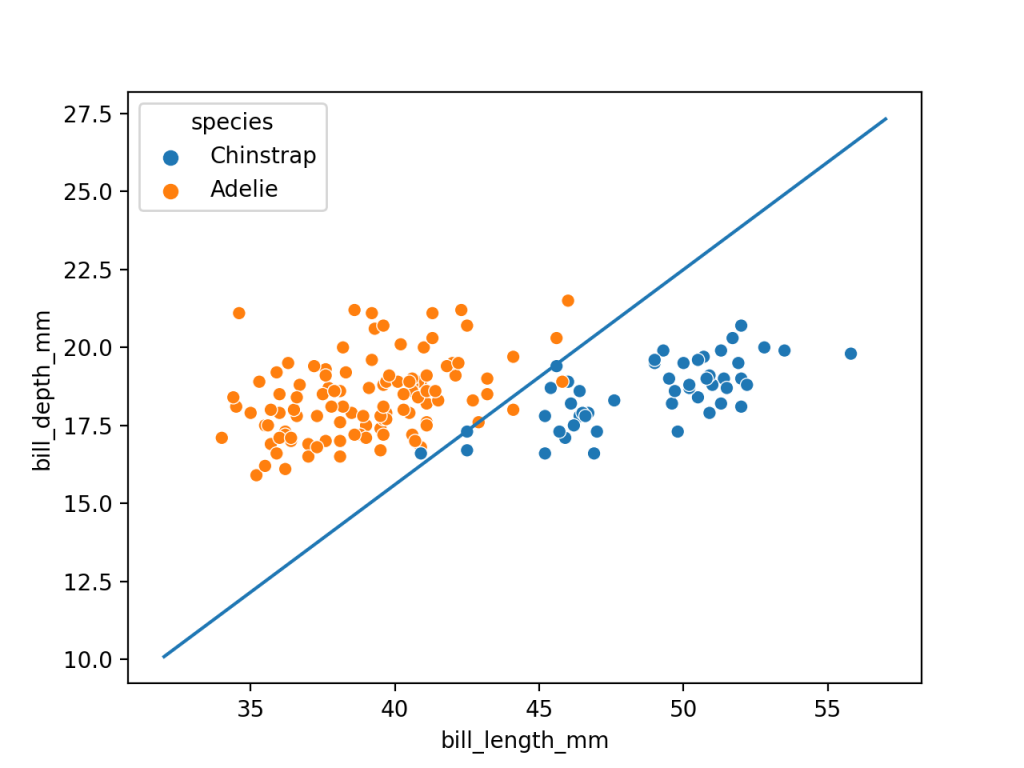
We were able to get the coefficient and intercept for our data points and plotted them. One thing you’ll notice is that the data can’t be perfectly separated like our earlier examples. Let’s explore this a little further.
Soft Margin Classification in Support Vector Machines
In these cases you, as a data scientist, needs to decide whether to transform the data (and risk overfitting and computational overhead) or whether to soften the margin and allow misclassification of some data.
Softening the margin allows us to find a good balance between keeping a wide margin and limiting the number of margin violations that occur. We’ll explore this a little further when we discuss hyperparameters. For now, it’s important to recognize that by having a harder margin, our data may not generalize to new data as well. By having too soft a margin, our data may not classify well to begin with.
Testing the Accuracy of our SVM Algorithm
Now that we’ve worked through this aside, lets begin looking at how we can test the accuracy of our model. Since our model aims to classify something, it’s either right or wrong for each data point. Because we already split our data into training and testing data, we can actually run a simple accuracy statistics.
Sklearn comes with a function, accuracy_score(), that calculates the proportion of accurate predictions the model made out of the total number of predictions. Let’s use this function to see how accurate our model is.
We’ll expand the scope to the original intent of the algorithm, to classify all three penguin specifies:
# Testing the accuracy of our model
df = load_dataset('penguins')
df = df.dropna()

X = df[['bill_length_mm', 'bill_depth_mm']]
y = df['species']

X_train, X_test, y_train, y_test = train_test_split(X, y, random_state=100)

clf = SVC(kernel='linear')
clf.fit(X_train, y_train)

predictions = clf.predict(X_test)
print(accuracy_score(y_test, predictions))

# Returns: 0.9761904761904762
We can see here that our model’s accuracy is 97%! Let’s take a look at how we can add in categorical variables to make use of the rest of the dimensions we have access to.
Working with Categorical Data in Support Vector Machines
By their nature, machine learning algorithms cannot work with non-numeric data. This means that when our dataset has features that aren’t numeric, we need to find a way to transform them into types that the algorithm can work with.
One of the most common processes for this is One-Hot Encoding. One-hot encoding takes a categorical feature and converts it into binary columns. Take a look at the image below that illustrates what happens:
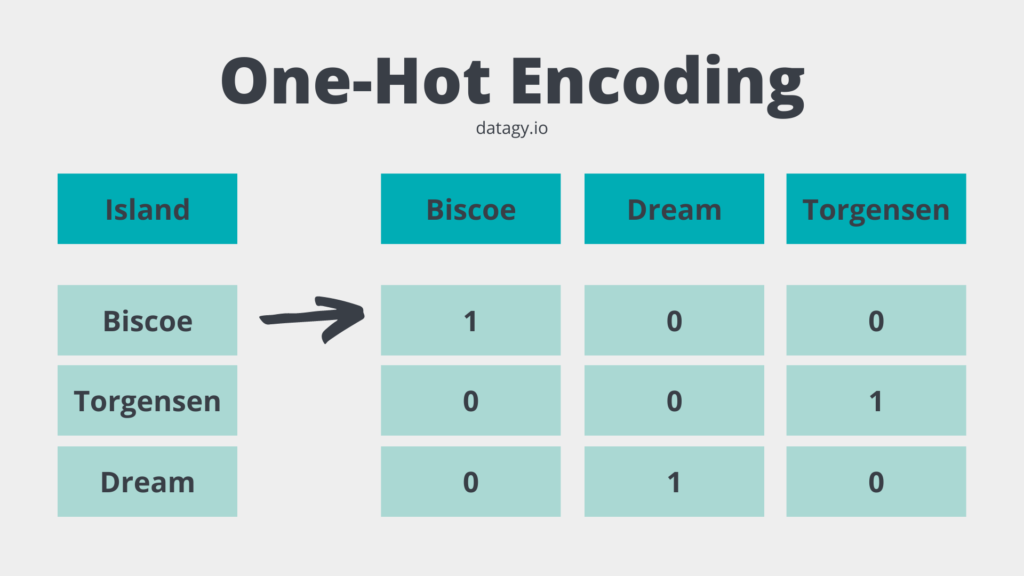
Each unique value in the categorical column is given its own column. If that value matches the column, then it’s assigned a value of 1. Otherwise, it’s assigned a value of 0.
While it may seem more efficient to assign each category a value of, say, [0, 1, 2], this isn’t always a great idea. Unless the ordering of our data has meaning, such as with, say, clothing sizes, this has the potential to misrepresent the distances between our data.
In the same data above, the island Dream isn’t any more different from Torgensen than Biscoe. Because of this one-hot encoding is a safer option for categorical, non-ordinal data.
In order to one-hot encode our data in sklearn, we can make use of the OneHotEncoder class and the make_column_transformer() function. Let’s see how we can one-hot encode our columns, island and sex:
# One-hot encoding categorical variables in Sklearn
from seaborn import load_dataset, pairplot
import matplotlib.pyplot as plt
import pandas as pd
from sklearn.svm import SVC
from sklearn.model_selection import train_test_split
from sklearn.metrics import accuracy_score
from sklearn.preprocessing import OneHotEncoder
from sklearn.compose import make_column_transformer

df = load_dataset('penguins')
df = df.dropna()

X = df.drop(columns = ['species'])
y = df['species']

X_train, X_test, y_train, y_test = train_test_split(X, y, random_state = 100)

column_transformer = make_column_transformer(
    (OneHotEncoder(), ['sex', 'island']),
    remainder='passthrough')

X_train = column_transformer.fit_transform(X_train)
X_train = pd.DataFrame(data=X_train, columns=column_transformer.get_feature_names_out())
Let’s break down what we did here, as we’ve changed some of the lines of code from above:
- We loaded the data and dropped missing records
- For
X, we now load all columns except for the target column,'species' - We split the data into training and testing data in the same way as before
- We then make a new variable,
column_transformerthat applies theOneHotEncoderclass to the sex and island columns. - The
remainder=parameter determines what to do with the remaining columns. We’re telling sklearn to simply pass through these. - We fit and transform the
X_traindata with the.fit_transform()method - Finally, we turn that array back into a Pandas DataFrame
Our data now looks like this:
# Exploring the data
print(X_train.iloc[:5, :4])

# Returns:
#    onehotencoder__sex_Female  onehotencoder__sex_Male  onehotencoder__island_Biscoe  onehotencoder__island_Dream
# 0                        1.0                      0.0                           1.0                          0.0
# 1                        1.0                      0.0                           0.0                          0.0
# 2                        0.0                      1.0                           0.0                          0.0
# 3                        1.0                      0.0                           1.0                          0.0
# 4                        0.0                      1.0                           0.0                          1.0
We can see that the data now also has our one-hot encoded columns. We can now use these columns in our algorithm!
Standardizing Data for Support Vector Machines
Support vector machines are optimized by the effectiveness of the hyperplane. If our data has different ranges, this can leader to one dimension dominating the others. For example, in our data we now have some binary values (0 or 1) and other data that ranges into the hundreds.
Because the kernel values tend to depend on the dot product of feature vectors, larger ranges can create problems.
In order to circumvent the problem of some dimensions dominating others, we can standardize our data. When we scale our data, the data will have a mean of 0 and a standard deviation of 1.
We can scale our data using the StandardScaler class in sklearn. Because we have already set up a column transformer, we can actually just add this step into it. We’ll apply the transformation to all the numeric columns.
Let’s see how this can work:
# Scaling our data in sklearn
from seaborn import load_dataset, pairplot
import matplotlib.pyplot as plt
import pandas as pd
from sklearn.svm import SVC
from sklearn.model_selection import train_test_split
from sklearn.metrics import accuracy_score
from sklearn.preprocessing import OneHotEncoder
from sklearn.compose import make_column_transformer
from sklearn.preprocessing import StandardScaler

df = load_dataset('penguins')
df = df.dropna()

X = df.drop(columns = ['species'])
y = df['species']

X_train, X_test, y_train, y_test = train_test_split(X, y, random_state = 100)

column_transformer = make_column_transformer(
    (OneHotEncoder(), ['sex', 'island']),
    (StandardScaler(), ['bill_depth_mm', 'bill_length_mm', 'flipper_length_mm', 'body_mass_g']),
    remainder='passthrough')

X_train = column_transformer.fit_transform(X_train)
X_train = pd.DataFrame(data=X_train, columns=column_transformer.get_feature_names_out())
The main thing we have added here is importing the StandardScaler class and adding the additional transformation to our dataset.
In the next section, you’ll learn more about the different hyperparameters that we can apply to tweak our model.
Hyper-Parameters of the SVM Algorithm in Scikit-Learn
The support vector machine classifier model in sklearn comes with a number of hyper-parameters. In this tutorial, we’ll focus on three main ones:
C=, which defines the regularization of the error.kernel=, which defines what type of function is used to transform the datasetgamma=defines how loosely the model will fit the training data, allowing you to prevent overfitting
Let’s take a look at each of these parameters in-depth, to really understand what they’re doing.
Understanding C for Regularization in Support Vector Machines
In an earlier section, you learned that because most data sets aren’t perfect and overlap occurs, it’s important to find a balance between the softness of your margin and the number of misclassifications that occur.
This is the “art” of data science – there is no set answer for what the best margin is, but it varies from dataset to dataset. More importantly, the context varies greatly, too. There are some domains in which error is more acceptable. In other domains, such as medicine, error can be negatively life-changing.
The C parameter of the SVC class is the parameter that regulates how soft a margin can be. By default, it is given a value of 1. Generally speaking, the values can be thought os as:
- The smaller the value of
C, the wider the margins – which may lead to more misclassifications. - Inversely, the larger the value of
C, the more narrow the margins of the classifier become – this may lead to fewer misclassifications.
At this point, you may be thinking, “Well, Nik, I’ll just crank up the value of C!” In theory this sounds great. However, it will likely lead to overfitting your model. This means that your model does not generalize well to new data.
Understanding Kernels in Support Vector Machines
Let’s talk about the kernel now. You’ve already seen the power of transformations in being able to more clearly separate your data. This is where the kernel comes in. A kernel transformation looks at the similarly relationship (or kernel) between each pair of points and aims to find the best function transformation for that relationship.
For example, the kernel can take a number of different forms, depending on the relationship we want it to use. These can take different forms, including linear, nonlinear, polynomial, radial basis function, and sigmoid. Of these, the radial basis function is the most common. The rbf allows us to overcome space complexities since it only needs to store the support vectors during training (rather than the entire dataset).
Of course, calculating the actual values of each of these feature spaces would be computationally expensive. Because of this, data scientists and sklearn apply what’s referred to as the kernel trick, in which the data are not explicitly mapped. Instead, an implicit feature space is created without calculating the new coordinates.
The kernel trick, then, saves us much computing cost and simply calculates the inner products between the images of all pairs of data in the feature space.
Understanding Gamma for Regularization in Support Vector Machines
Finally, let’s take a look at the gamma hyperparameter. The gamma defines how far the influence of a single training example reaches. The lower the value, the further the reach of a training point. Inversely, the larger the value, the lower the reach of the training point.
Because of this inverse relationship, we can say that using a smaller gamma may mean that a model is more generalized. Inversely, the larger the value of gamma, the more likely the model may be overfitted to the training data.
In short: a small gamma will lower your bias but increase your variance, while a large gamma will increase your bias but lower your variance.
Hyper-Parameter Tuning and Cross-Validation for Support Vector Machines
In this section, you’ll learn how to apply your new knowledge of the different hyperparameters available in the support vector machines algorithm. Hyperparameters refer to the variables that are specified while building your model (that don’t come from the data itself).
Hyper-parameter tuning, then, refers to the process of tuning these values to ensure a higher accuracy score. One way to do this is, simply, to plug in different values and see which hyper-parameters return the highest score.
This, however, is quite time-consuming. Scikit-Learn comes with a class GridSearchCV which makes the process simpler. You simply provide a dictionary of values to run through and sklearn returns the values that worked best.
By using this class, sklearn actually handles cross-validation as well. What this means is that it doesn’t simply split the data into one training and testing set, but rather into k sets and runs through each one to find the optimal hyperparameters.
Want to learn about a more efficient way to optimize hyperparameters? You can optimize and speed up your hyperparameter tuning using the Optuna library.
Let’s take a look at the three hyperparameters we explored in the previous section. We can create a dictionary for the various values that we want to loop through:
# Finding the best hyperparameters
params = {
    'C': [0.1, 1, 10, 100, 1000],
    'gamma': [1, 0.1, 0.01, 0.001, 0.0001],
    'kernel': ['rbf']
}

clf = GridSearchCV(
    estimator=SVC(),
    param_grid=params,
    cv=5,
    n_jobs=5,
    verbose=1
)

clf.fit(X_train, y_train)
print(clf.best_params_)

# Returns: {'C': 1000, 'gamma': 0.01, 'kernel': 'rbf'}
Let’s break down what we did here:
- We defined a dictionary of the different hyperparameters and their values to test
- We created a new
GridSearchCVobject. In this, we passed in that we wanted to use theSVC()estimator with our parameter grid. - We fit the training data into this new GridSearchCV object, which runs through the different permutations of the search
- Finally, we access the
.best_params_attribute, which tells us what the best values are (for the values we provided)
In this case, the best selection for hyperparameters to use are:
C=1000,gamma=0.01kernel='rbf'
Support Vector Machines in Sklearn: Putting it All Together
In this final section, we’ll see what our code looks like now that it’s all come together. The code below cleans up everything we did above and learned about what hyperparameters to apply:
from seaborn import load_dataset
import pandas as pd
from sklearn.svm import SVC
from sklearn.model_selection import train_test_split
from sklearn.preprocessing import OneHotEncoder
from sklearn.compose import make_column_transformer
from sklearn.preprocessing import StandardScaler
from sklearn.metrics import accuracy_score

# Load the data and create training and testing data
df = load_dataset('penguins')
df = df.dropna()
X = df.drop(columns = ['species'])
y = df['species']

X_train, X_test, y_train, y_test = train_test_split(X, y, random_state = 100)

# Create a transformer object
column_transformer = make_column_transformer(
    (OneHotEncoder(), ['sex', 'island']),
    (StandardScaler(), ['bill_depth_mm', 'bill_length_mm', 'flipper_length_mm', 'body_mass_g']),
    remainder='passthrough')

# Transform the training features
X_train = column_transformer.fit_transform(X_train)
X_train = pd.DataFrame(data=X_train, columns=column_transformer.get_feature_names_out())

# Building and fit the classifier
clf = SVC(kernel='rbf', gamma=0.01, C=1000)
clf.fit(X_train, y_train)

# Transform the training data
X_test = column_transformer.transform(X_test)
X_test = pd.DataFrame(data=X_test, columns=column_transformer.get_feature_names_out())

# Make predictions and check the accuracy
predictions = clf.predict(X_test)
print(accuracy_score(y_test, predictions))

# Returns: 0.9880952380952381
We can see that the accuracy is nearly 99%!
It’s important to note that accuracy is just a single criterion for evaluating the performance of a classification problem. If you want to learn more about this, check out my in-depth post on calculating and visualizing a confusion matrix in Python.
Now that we have our model, we can actually go one step further. Let’s imagine we have a pet penguin but don’t actually know what species it is. We find our penguin (let’s call her Penny) and take some measurements. We can now take our model to predict Penny’s species. Let’s see how we can do this:
# Passing in our own data:
penny = [{
    'sex': 'Female',
    'island': 'Torgersen',
    'bill_depth_mm': 23.3,
    'bill_length_mm': 43.5,
    'flipper_length_mm': 190,
    'body_mass_g': 4123
}]

penny = pd.DataFrame(penny)
df_transformed = column_transformer.transform(penny)
df_transformed = pd.DataFrame(df_transformed, columns=column_transformer.get_feature_names_out())
predicted_species = clf.predict(df_transformed)
print(predicted_species)

# Returns: ['Adelie']
We can be quite confident that Penny is an Adelie penguin!
Conclusion
In this tutorial, you learned all about the support vector machines algorithm. You learned the motivations and concepts behind how the algorithm works and why it’s a great algorithm for classification problems.
Then, you learned how to create the SVM algorithm in Scikit-Learn using the SVC class. You learned how to evaluate the model’s performance and tune its hyperparameters. You also learned how to work with categorical data as well as how to scale your data to prevent some dimensions from having too much unintended influence.
Additional Resources
To learn more about related topics, check out the tutorials below:
Pingback: When to use SVM algorithm? - What Type Degree
Pingback: When to use support vector machines? - What Type Degree