Standard deviation is a crucial concept in the fields of data analysis and statistics. It provides a measure of the variability or dispersion of a dataset, helping to determine the degree of consistency or variation within a set of values. Python offers multiple ways to calculate the standard deviation simplifying the data analysis process.
In this comprehensive guide, we’ll dive into the importance of standard deviation and explore various methods of calculating it in Python, using different libraries: the statistics library, NumPy, and Pandas. Additionally, this tutorial will investigate how to calculate standard deviation from scratch and guide you through choosing the appropriate method for your specific situation.
Table of Contents
The Quick Answer: Calculating Standard Deviation in Python
The table below breaks down the different ways of calculating the standard deviation in Python and when to use which method.
| Library | Function | Description | When To Use |
|---|---|---|---|
statistics | stdev() | Sample standard deviation | When you need to use the standard library only |
statistics | pstdev() | Population standard deviation | When you need to use the standard library only |
numpy | np.std(ddof=1) | Sample standard deviation | When using NumPy |
numpy | np.std() | Population standard deviation | When using NumPy |
pandas | .std() | Sample standard deviation | When using Pandas |
pandas | .std(ddof=0) | Population standard deviation | When using Pandas |
What is Standard Deviation?
Standard deviation is a helpful way to measure how “spread out” values in a data set are. But how do you interpret a standard deviation?
A small standard deviation means that most of the numbers are close to the mean (average) value. However, a large standard deviation means that the values are further away from the mean.
Two data sets could have the same average value but could be entirely different in terms of how those values are distributed. This is where the standard deviation is important. Similarly, we can use the z-score to see how many standard deviations a value is away from the mean.
Two Types of Standard Deviation
Population and sample standard deviations are two types of standard deviation calculations. The population standard deviation pertains to the entire data set, while the sample standard deviation concerns a subset or sample of the population.
The formula for calculating population standard deviation is given by the square root of the average of the squared differences between each data point and the population mean. In contrast, the formula for sample standard deviation is similar but has a slight adjustment. Instead of dividing by the number of data points in the sample (n), the equation uses (n-1) as the denominator.
The standard deviation formulas look like this:
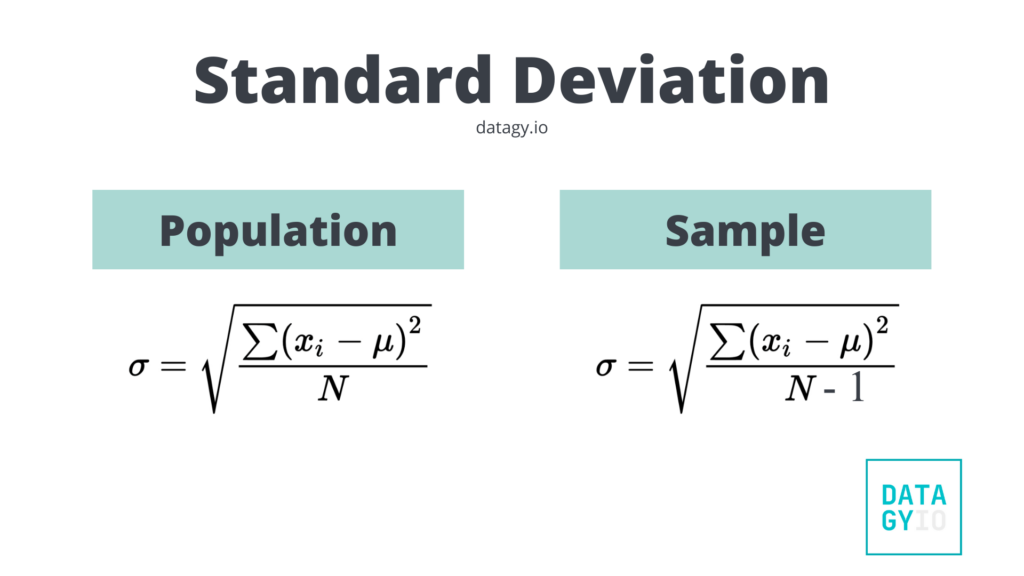
Let’s break this down a bit:
Σis a fun way of writing “sum of”xirepresents every value in the data setμis the mean (average) value in the data setnis the sample size
Calculating the Standard Deviation in Python
Many different Python libraries provide options for calculating the standard deviation of different values. In my experience, there are three libraries that are best suited for calculating it:
- The
statisticsprovides two functions:stdev()for calculating the sample standard deviation, andpstdev()for calculating the population standard deviation
- NumPy provides the
std()function - Pandas allows you to use the
.std()method, using NumPy under the hood
Let’s explore these three libraries!
Using Python statistics to Calculate the Standard Deviation in Python
The Python statistics library is part of the standard library, which means that you don’t have to install anything additional. The library allows you to use two different functions:
stdev()for calculating the sample standard deviation, andpstdev()for calculating the population standard deviation
Let’s take a look at how we can calculate the standard deviation using both of these functions:
# Calculating the Standard Deviation with statistics
import statistics
data = [1,2,3,4,5,5,5,5,10]

sample_std = statistics.stdev(data)
population_std = statistics.pstdev(data)
print('Sample standard deviation: ', sample_std)
print('Population standard deviation: ', population_std)

# Returns:
# Sample standard deviation:  2.5549516194593154
# Population standard deviation:  2.4088314876309775
We can see that by using the statistics library, we’re able to explicitly identify what type of standard deviation we’re calculating. This can be beneficial for readers of your code, letting them know what type of data you’re working with.
You can see from the sample datasets above, that the standard deviations are quite different. As the number of data points grows, the difference between these two values will decrease.
Using NumPy to Calculate the Standard Deviation
NumPy, on the other hand, provides only a single function to calculate the standard deviation: np.std(). That said, the function allows you to calculate both the sample and the population standard deviations using the ddof= parameter.
The parameter represents the delta degrees of freedom. By passing in the value of 1, we can calculate the sample standard deviation. By default, this is set to 0.
Let’s take a look at how we can calculate both the standard deviations of a NumPy array:
# Calculating the Standard Deviation with NumPy
import numpy as np

data = [1,2,3,4,5,5,5,5,10]
arr = np.array(data)

sample_std = np.std(arr, ddof=1)
population_std = np.std(arr)
print('Sample standard deviation: ', sample_std)
print('Population standard deviation: ', population_std)

# Returns:
# Sample standard deviation:  2.5549516194593154
# Population standard deviation:  2.4088314876309775
We can see that NumPy makes it easy to calculate the standard deviation. However, because the library provides only a single function, it can be a little less explicit. This means it may be necessary to indicate to your code’s reader which type of standard deviation you’re calculating. Using this function is recommended when you’re working with NumPy arrays, since it will perform much, much faster!
Using Pandas to Calculate the Standard Deviation
If you are working with Pandas, you may be wondering if Pandas has a method for standard deviations. Pandas lets you calculate a standard deviation for either a Series, or even an entire Pandas DataFrame. Similar to NumPy, Pandas provides only a single method, .std().
Unlike NumPy, however, Pandas will calculate the standard deviation for a sample of data by default. The method uses the ddof= argument to control the type of standard deviation to calculate. By default, the value is set to 1. Let’s see how we can use Pandas to calculate both the sample and population standard deviations:
# Calculating the Standard Deviation with Pandas
import pandas as pd

data = [1,2,3,4,5,5,5,5,10]
df = pd.DataFrame(data, columns=['Data'])

sample_std = df['Data'].std()
population_std = df['Data'].std(ddof=0)
print('Sample standard deviation: ', sample_std)
print('Population standard deviation: ', population_std)

# Returns:
# Sample standard deviation:  2.5549516194593154
# Population standard deviation:  2.4088314876309775
In the code block above, we loaded our data into a DataFrame. From there, we calculated both standard deviations. It’s important to make note of the fact that the default argument for ddof= is different than in NumPy. In my opinion, this is unnecessarily confusing. It’s helpful to be explicit when calculating the standard deviation, such as by naming the variable something meaningful.
How to Calculate the Standard Deviation From Scratch in Python
In this section, we’ll explore how to calculate a standard deviation from scratch. In order to do this, we won’t use any library, including built-in ones. We’ll only make use of the sum() and len() functions and develop our own function.
Take a look at the code block below to see how we can create our own custom function:
# Calculate the Standard Deviation From Scratch in Python
def standard_deviation(data, ddof=0):
    # Calculate the mean of the data
    mean_data = sum(data) / len(data)

    # Calculate squared differences for each data point and mean
    squared_diffs = [(x - mean_data) ** 2for x in data]

    # Calculate the average of the squared differences
    variance = sum(squared_diffs) / (len(squared_diffs) - ddof)

    # Calculate the square root of the variance
    stddev = variance ** 0.5
    return stddev
Let’s break down how our function works:
- We calculate the mean of our dataset
- Then, we use a list comprehension to calculate the squared differences
- We then divide the sum of the squared differences by the length of the dataset (or the length minus 1, depending on the type of standard deviation we want to calculate)
- Finally, we calculate the value by taking the square root of the variance
Let’s take a look at how we can use this function to calculate the standard deviation of a list of values:
# Example usage of our custom function
data = [1,2,3,4,5,5,5,5,10]

sample_std = standard_deviation(data, ddof=1)
population_std = standard_deviation(data)

print('Sample standard deviation: ', sample_std)
print('Population standard deviation: ', population_std)

# Returns:
# Sample standard deviation:  2.5549516194593154
# Population standard deviation:  2.4088314876309775
We can see that this function returns the same results as we saw before!
Now, let’s take a look at how we can calculate the standard deviation of both a list of values in Python.
Calculate the Standard Deviation of a List in Python
In order to calculate the standard deviation of a list of values, we can use any of the approaches outlined above. Since the statistics library is part of the standard library, this can be a reliable way to calculate the standard deviations in Python. Let’s see how we can accomplish this:
# Calculate the Standard Deviations of a List in Python
import statistics

data = [1,2,3,4,5,5,5,5,10]

sample_std = statistics.stdev(data)
population_std = statistics.pstdev(data)
print('Sample standard deviation: ', sample_std)
print('Population standard deviation: ', population_std)

# Returns:
# Sample standard deviation:  2.5549516194593154
# Population standard deviation:  2.4088314876309775
We can see by using the statistics library, we can easily calculate the standard deviation of a list of values. Let’s now take a look at how we can calculate the standard deviation of a dictionary’s values.
Calculate the Standard Deviation of a Dictionary’s Values in Python
Similar to calculating the standard deviations of a list of values, we can use the statistics library to calculate the standard deviation of a dictionary’s values. In order to do this, we can first access the values by using the .values() method. Let’s see how we can accomplish this in Python:
# Calculate the Standard Deviations of a Dictionary in Python
import statistics

data = {0: 1, 1: 2, 2: 3, 3: 4, 4: 5, 5: 5, 6: 5, 7: 5, 8: 10}

sample_std = statistics.stdev(data.values())
population_std = statistics.pstdev(data.values())
print('Sample standard deviation: ', sample_std)
print('Population standard deviation: ', population_std)

# Returns:
# Sample standard deviation:  2.5549516194593154
# Population standard deviation:  2.4088314876309775
In the code block above, we have a dictionary and want to calculate the standard deviation of the dictionary’s values. In order to do this, we use the statistics library. We pass the values in, by accessing them using the .values() method.
Conclusion
In this post, we learned all about the standard deviation. We started off by learning what it is and how it’s calculated, and why it’s significant. Then, we learned how to calculate the standard deviation in Python, using the statistics module, Numpy, and finally applying it to Pandas. We closed the tutorial off by demonstrating how the standard deviation can be calculated from scratch using basic Python!
To learn more about the statistics library’s functions for standard deviation, check out the official documentation.
Pingback: Pandas Quantile: Calculate Percentiles of a Dataframe • datagy
Pingback: Normalize a Pandas Column or Dataframe (w/ Pandas or sklearn) • datagy
Pingback: How to Calculate a Z-Score in Python (4 Ways) • datagy
I suggest you address population standard deviation versus sample standard deviation.
You used sigma for sample standard deviation but the symbol should be s for a sample. We use sigma for population standard deviation. For sigma, we divide by n, not n-1.
Showing both pstdev and stdev in the statistics library would be helpful for your readers.
Reference for you: https://www.statlogy.org/standard-deviation-of-list-python/
Thanks Robert! I have added this to my list to rewrite :). I appreciate the comment!