
In this tutorial, you’ll learn how to use the Pandas quantile function to calculate percentiles and quantiles of your Pandas Dataframe. Being able to calculate quantiles and percentiles allows you to easily compare data against the other values in the data. You’ll learn how to use the Pandas quantile method, to calculate percentiles and quartiles, as well as how to use the different parameters to modify the method’s behaviour.
By the end of this tutorial, you’ll have learned:
- Why you may want to calculate a percentile
- How to calculate a single percentile of a Pandas column
- How to calculate multiple percentiles or quartiles of a Pandas column
- How to calculate percentiles of an entire dataframe
- How to modify the interpolation of values when calculating percentiles
The Quick Answer: Use Pandas quantile to Calculate Percentiles
Updated in April 2023: I have updated the post to add more examples and explanations of the Pandas quantile() function. I have also updated the post to reflect changes made in Pandas 2.0.
Table of Contents
What is a Percentile?
A percentile refers to a number where certain percentages fall below that number. For example, if we calculate the 90th percentile, then we return a number where 90% of all other numbers fall below that number. This has many useful applications, such as in education. Scoring the in 90th percentile does not mean you scored 90% on a test, but that you scored better than 90% of other test takers.
A quartile, however, splits the data into four equal chunks of data, split into 25% values. The quartile, therefore, is really splitting the data into percentiles of 0%, 25%, 50%, and 75%.
Being able to calculate a percentile has many useful applications, such as working with outliers. Because outliers have a large effect on machine learning models that may skew their performance, you may want to be aware of them. For example, you want want to know how many values fall in and outside of the 5th and 95th percentile to see how much skew of your data to expect.
Let’s get started with learning how to calculate a percentile in Pandas using the quantile function.
Loading a Sample Pandas Dataframe
Let’s start off by loading a sample Pandas Dataframe. If you have your own data, feel free to use that. However, if you want to follow along with this tutorial line by line, copy the code below to generate our dataframe:
# Loading a Sample Pandas Dataframe
import pandas as pd

df = pd.DataFrame.from_dict({
    'Student': ['Nik', 'Kate', 'Kevin', 'Evan', 'Jane', 'Kyra', 'Melissa'],
    'English': [90, 95, 75, 93, 60, 85, 75],
    'Chemistry': [95, 95, 75, 65, 50, 85, 100],
    'Math': [100, 95, 50, 75, 90, 50, 80]
})

print(df.head())

# Returns:
#   Student  English  Chemistry  Math
# 0     Nik       90         95   100
# 1    Kate       95         95    95
# 2   Kevin       75         75    50
# 3    Evan       93         65    75
# 4    Jane       60         50    90
We can see that we’ve loaded a Pandas Dataframe covering student’s grades. We have a single 'object' column containing our student names and three other numeric columns containing students’ grades.
Now, let’s dive into understanding how the Pandas quantile method works.
Pandas Quantile Method Overview
The Pandas quantile method works on either a Pandas series or an entire Pandas Dataframe. By default, it returns the 50th percentile and interpolates the data using linear interpolation.
Let’s take a look at what the method looks like and what parameters the quantile method provides:
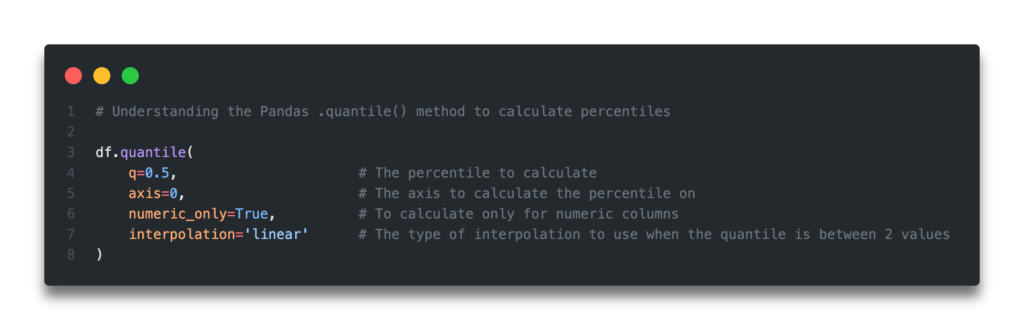
# Understanding the Pandas .quantile() method to calculate percentiles

df.quantile(
    q=0.5,                      # The percentile to calculate
    axis=0,                     # The axis to calculate the percentile on
    numeric_only=False,         # To calculate only for numeric columns
    interpolation='linear'      # The type of interpolation to use when the quantile is between 2 values
)
Let’s take a look at the different parameters that the Pandas quantile method offers. The default arguments are provided in square [] brackets. Beginning in April 2023 with Pandas 2.0, the default argument for numeric_only is set to False. This has a big impact on legacy code, forcing your code to be more explicit.
q=[0.5]: a float or an array that provides the value(s) of quantiles to calculateaxis=[0]: the axis to calculate the percentiles on (0 for row-wise and 1 for column-wise)numeric_only=[True]: is set toFalse, calculate the values for datetime and timedelta columns as wellinterpolation=['linear']: if quantiles exist between two values, how to interpolate the values
Now that you’ve learned about the different arguments available, let’s jump in and calculate a percentile for a given column.
Use Pandas Quantile to Calculate a Single Percentile
In this section, you’ll learn how to calculate a single percentile on a Pandas Dataframe column using the quantile method. We can simply apply the method to a given column and the percentile is returned. Let’s see what this looks like:
# Generate a single percentile with df.quantile()
print(df['English'].quantile())

# Returns: 85.0
By default, Pandas will use a parameter of q=0.5, which will generate the 50th percentile. If we wanted to, say, calculate a 90th percentile, we can pass in a value of q=0.9 in to parameters:
# Generate a single percentile with df.quantile()
print(df['English'].quantile(q=0.9))

# Returns: 93.8
We can see that by passing in only a single value into the q= argument that a single value is returned. But what if we wanted to calculate a number of percentiles for a single Pandas column? This is what you’ll learn in the next section.
Use Pandas Quantile to Calculate Multiple Percentiles
There may be many times that you want to calculate a number of different percentiles for a Pandas column. The q= argument accepts either a single number or an array of numbers that we want to calculate.
If we wanted to calculate multiple percentiles, we simply pass in a list of values for the different percentiles we want to calculate. Let’s see what this looks like:
# Generate multiple percentiles with df.quantile()
print(df['English'].quantile(q=[0.1, 0.9]))

# Returns:
# 0.1    69.0
# 0.9    93.8
# Name: English, dtype: float64
This returns a Pandas series containing the different percentile values. If we wanted to access a single value in this series, we can simply access it by selecting its index. Let’s see how we can select the 90th percentile in our series:
# Generate multiple percentiles with df.quantile() and selecting one
print(df['English'].quantile(q=[0.1, 0.9])[0.9])

# Returns: 93.8
This is a helpful method if you want to be able to calculate multiple percentiles in one go but use the values of these percentiles programatically.
In the next section, you’ll learn how to use Pandas to calculate percentiles of an entire dataframe.
Use Pandas Quantile to Calculate Percentiles of a Dataframe
In many cases, you may want to calculate percentiles of all columns in a dataframe. In our example, we have columns that display grades for different students in a variety of subjects. Instead of needing to calculate the percentiles for each subject, we can simply calculate the percentiles for the entire dataframe, thereby speeding up our workflow.
Let’s see how this works by calculating the 90th percentile for every column:
# Calculate Percentile for a Pandas Dataframe
print(df.quantile(q=0.9, numeric_only=True))

# Returns:
# English      93.8
# Chemistry    97.0
# Math         97.0
# Name: 0.9, dtype: float64
We can see how easy it was to calculate a single percentile for all columns in a Pandas Dataframe. Beginning with Pandas 2.0, Pandas will require you to set the numeric_only= parameter to True. This is a big departure from previous versions, where this was set to True by default.
If you wanted to calculate multiple percentiles for an entire dataframe, you can pass in a list of values to calculate. Let’s calculate a number of different percentiles using Pandas’ quantile method:
# Calculate Multiple Percentiles for an Entire DataFrame
print(df.quantile(q=[0.1, 0.5, 0.9], numeric_only=True))

# Returns:
#      English  Chemistry  Math
# 0.1     69.0       59.0  50.0
# 0.5     85.0       85.0  80.0
# 0.9     93.8       97.0  97.0
We can see that Pandas actually returns a dataframe containing the breakout of percentiles by the different columns. We can use .loc or .iloc to select data, which you can learn how to do here.
In the next section, you’ll learn how to modify how Pandas interpolates percentiles when the percentile falls between two values.
Use Pandas Quantile to Calculate Percentiles and Modify Interpolation
When calculating a percentile, you may encounter a situation where the percentile falls between two values. In these cases, a decision needs to be made as to how to calculate the percentile. For example, you could select the midpoint between the two values, the lower / upper bound, or an interpolated value.
This is where the interpolation= parameter comes into play. By default, Pandas will use a linear interpolation to generate the percentile, meaning it will treat the values as linear and find the linearly interpolated value.
Pandas also provides a number of options to modify this behaviour. These options are broken out in the table below, assuming two values i and j:
| Interpolation Argument | Description |
|---|---|
| linear | Calculates based on a linear assumption, using the formula i + (j – i) |
| lower | chooses the lower value, i |
| higher | chooses the higher value, j |
| nearest | chooses whichever value is closest, either i or j |
| midpoint | calculates the midpoint using (i + j) / 2 |
Let’s see how these values might differ for a single column:
# Interpolating Percentiles in Different Ways
linear = df['Math'].quantile(q=0.9, interpolation='linear')
lower = df['Math'].quantile(q=0.9, interpolation='lower')
higher = df['Math'].quantile(q=0.9, interpolation='higher')
nearest = df['Math'].quantile(q=0.9, interpolation='nearest')
midpoint = df['Math'].quantile(q=0.9, interpolation='midpoint')

print('linear returns: ', linear)
print('lower returns: ', lower)
print('higher returns: ', higher)
print('nearest returns: ', nearest)
print('midpoint returns: ', midpoint)

# Returns:
# linear returns:  97.0
# lower returns:  95
# higher returns:  100
# nearest returns:  95
# midpoint returns:  97.5
Being able to choose the type of interpolation, we can customize the results in a way that meets our needs.
Visualizing Percentiles with Boxplots
We can better visualize percentiles by making use of boxplots. You can create beautiful boxplots using the Python Seaborn library. In order to create boxplots in Seaborn, you can use the sns.boxplot() function.
The image below demonstrates how boxplots allow you to visualize percentiles:

Let’s see how we can use Seaborn to create a boxplot:
# Creating a Boxplot in Seaborn
import seaborn as sns
sns.set_style('whitegrid')
sns.set_palette('Set2')
sns.boxplot(df)
This returns the following image:
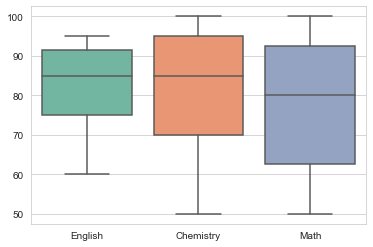
We can see that the boxplot helps visualize, by default, the 25%, 50%, and 75% percentiles. Boxplots can be an immensely valuable tool to help understand percentiles.
Handling Missing Values When Calculating Quantiles
By default, Pandas will ignore any missing values when calculating quantiles. This is important to know, since it impacts how you might perceive how the values should be calculated. If you do want to modify how these values are represented, you may want to choose to handle the missing values first. Similarly, you could drop the missing values, as they may skew your overall analysis.
Conclusion
In this tutorial, you learned how to use the Pandas quantile method to calculate percentiles of a dataframe. You learned how percentiles are used in different domains and how to calculate them using Pandas. You learned how to calculate them for a single percentile, for multiple percentiles, and for an entire dataframe. You also learned how to change the behaviour of interpolating values when the percentile falls between two values.
To learn more about the Pandas quantile method, check out the official documentation here.
Additional Documentation
Some other relevant articles are provided below:
Pingback: Creating Pivot Tables in Pandas with Python for Python and Pandas • datagy