
Pandas is the quintessential tool for data analysis in Python, but it’s not always the easiest to make data look presentable. For that, many analysts still turn to Excel to add data styles (such as currencies) or conditional formatting before sharing the data with our broader audiences. In this post, we’ll explore how to take these features that are commonplace in Excel and demonstrate how to take these on using the Pandas Style API!
Why would we want to style data? Our end goal should be to make the data easier for our readers to understand while maintaining the usability of the underlying data available in the dataframe. For example, 10% may be easier to understand than the value 0.10, but the proportion of 0.10 is more usable for further analysis.
Table of Contents
What is the Pandas Style API?
Pandas developed the styling API in 2019 and it’s gone through active development since then. The API returns a new Styler object, which has useful methods to apply formatting and styling to dataframes. The end styling is accomplished with CSS, through style-functions that are applied to scalars, series, or entire dataframes, via attribute:value pairs.
The Styler objects has two key methods:
- Styler.applymap – which applies styles element-wise
- Styler.apply – which applies styles column- / row- / dataframe-wise
Let’s get started by loading our data first.
Loading Our Sample Dataset
We’ll use the same dataset that’s available in our pivot table tutorial and we’ll use some of the steps we outlined there. If you’re not familiar with Pivot Tables in Pandas, we recommend checking out our tutorial.
import pandas as pd

df = pd.read_excel('https://github.com/datagy/mediumdata/raw/master/sample_pivot.xlsx', parse_dates=['Date'])

print(df.head())
Out:
Date Region Type Units Sales
0 2020-07-11 East Children's Clothing 18 306
1 2020-09-23 North Children's Clothing 14 448
2 2020-04-02 South Women's Clothing 17 425
3 2020-02-28 East Children's Clothing 26 832
4 2020-03-19 West Women's Clothing 3 33We can see that we have a number of sales, providing information on Region, Type, # of Units Sold and the total Sales Cost.
Let’s create a pivot table out of this, following our tutorial:
pivot = pd.pivot_table(df, index = ['Region', 'Type'], values = 'Sales', aggfunc = 'sum')

print(pivot)
Output:
Sales
Region Type
East Children's Clothing 45849
Men's Clothing 51685
Women's Clothing 70229
North Children's Clothing 37306
Men's Clothing 39975
Women's Clothing 61419
South Children's Clothing 18570
Men's Clothing 18542
Women's Clothing 22203
West Children's Clothing 20182
Men's Clothing 19077
Women's Clothing 22217Now that we have our data loaded and stored in a dataframe called pivot we can start styling our data in Pandas.
Data Type Labels to Pandas
In our dataframe pivot, the columns Sales represents the total number of sales in dollars. This isn’t immediately clear to the reader, however, as there is no dollar sign and the thousand values aren’t separated by commas. Let’s explore how to do this:
pivot.style.format({'Sales':'${0:,.0f}'})Output:
Sales
Region Type
East Children's Clothing $45,849
Men's Clothing $51,685
Women's Clothing $70,229
North Children's Clothing $37,306
Men's Clothing $39,975
Women's Clothing $61,419
South Children's Clothing $18,570
Men's Clothing $18,542
Women's Clothing $22,203
West Children's Clothing $20,182
Men's Clothing $19,077
Women's Clothing $22,217We can see that the data is immediately easier to understand!
String formats can be applied in different ways. Some other examples include:
- Float with 2 decimal places: {:.2f}
- Pad numbers with zeroes: {:0>2d}
- Percent with 2 decimal places: {:.2%}
To learn more about these, check out this excellent tutorial by Real Python.
If we wanted to pass formatting in for multiple columns, it might be easier to define a dictionary that can be passed onto the styling function. For example, we could write a dictionary like below:
format_dictionary = {
   'column1':'format1',
   'column2':'format2'
   }
Which could then be passed onto an object like below:
pivot.style.format(format_dictionary)Adding Conditional Formatting
Conditional formatting is a great tool easily available in Excel. It allows us to easily identify values based on their content. It’s equally easy in Pandas, but hidden away a little bit. We’ll show just how easy it is to achieve conditional formatting in Pandas.
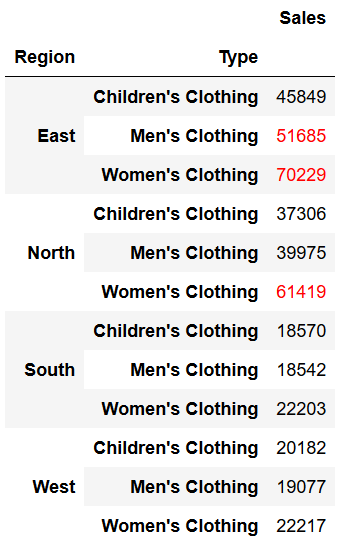
For example, if we wanted to highlight any number of sales that exceed $50,000 (say, they were eligible for a bonus after that point). We can do this using the applymap method. Before we begin, we’ll define a function we can pass onto the applymap method.
def highlight_fifty(val):
    color = 'red' if val > 50000 else 'black'
    return 'color: %s' % color
We can now pass this function into the applymap method:
pivot_highlight = pivot.style.applymap(highlight_fifty)
pivot_highlight
This returns the following dataframe:
We can also chain the data styling with our conditional formatting:
pivot_highlight = pivot.style.applymap(highlight_fifty).format({'Sales':'${0:,.0f}'})
pivot_highlight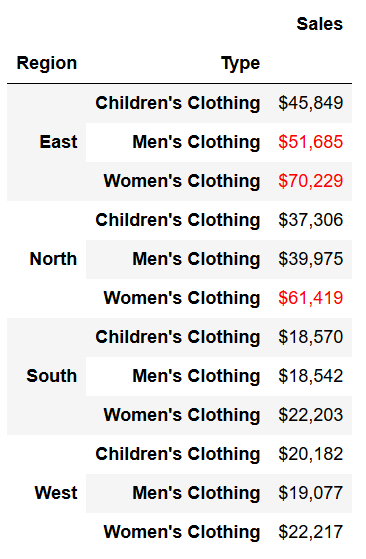
Making Chained Methods Easier to Read
Chaining methods is an incredibly useful feature in Python, but it’s not always the easiest to read. We can split the chain across multiple lines by using the \ character, as shown below:
pivot_highlight = pivot.style.format({'Sales':'${0:,.0f}'})\
   .highlight_max(color='green')\
   .highlight_min(color='red')
pivot_highlight
Now, say we wanted to highlight the maximum and minimum values, we can achieve this with another Styler object. While we could accomplish this using functions and the applymap method, Pandas thankfully has methods built-in directly to highlight the maximum and minimum values. In the example below, we provide named-colors, but you can also provide hex values to be more specific.
pivot.style.format({'Sales':'${0:,.0f}'}) \
   .highlight_max(color='green') \
   .highlight_min(color='red')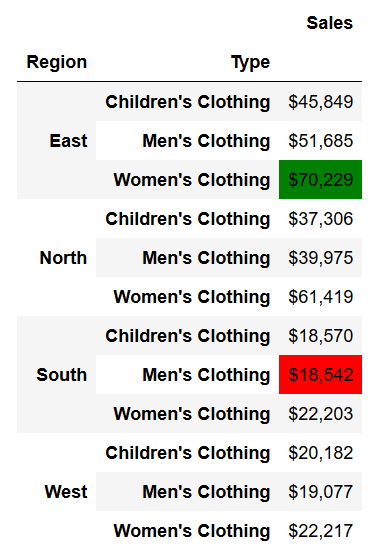
Adding Color Scales to Pandas
Sometimes we will want to identify the values within a column relative to one another. This is where color scales come into play. We can accomplish this quite easy as a style method using the background_gradient method. Let’s give this a shot:
pivot.style.background_gradient(cmap='Greens')This returns a dataframe like below:
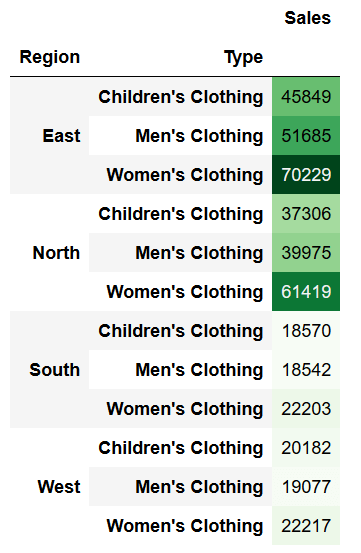
You can also use different cmaps. To learn more about cmaps, check out this Matplotlib guide.
Limiting Columns for Formatting
Let’s now generate a pivot table that has multiple columns of values:
pivot2 = pd.pivot_table(df, index = ['Region', 'Type'], values = 'Sales', aggfunc = ['sum','count'])This creates a pivot table that looks like this:
 		                sum 	count
		                Sales 	Sales
Region 	Type
East 	Children's Clothing 	45849 	113
        Men's   Clothing 	51685 	122
        Women's Clothing 	70229 	176
North 	Children's Clothing 	37306 	85
        Men's   Clothing 	39975 	89
        Women's Clothing 	61419 	142
South 	Children's Clothing 	18570 	45
        Men's   Clothing 	18542 	39
        Women's Clothing 	22203 	53
West 	Children's Clothing 	20182 	42
        Men's   Clothing 	19077 	41
        Women's Clothing 	22217 	53
Now, let’s apply the background_gradient method:
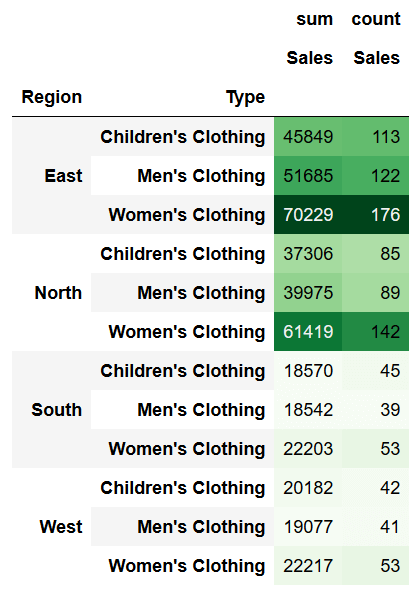
pivot2.style.background_gradient(cmap='Greens')This returns the following dataframe:
If we wanted to limit this to only one column, we can use the subset parameter, as shown below:
pivot2.style.background_gradient(subset=['sum'], cmap='Greens')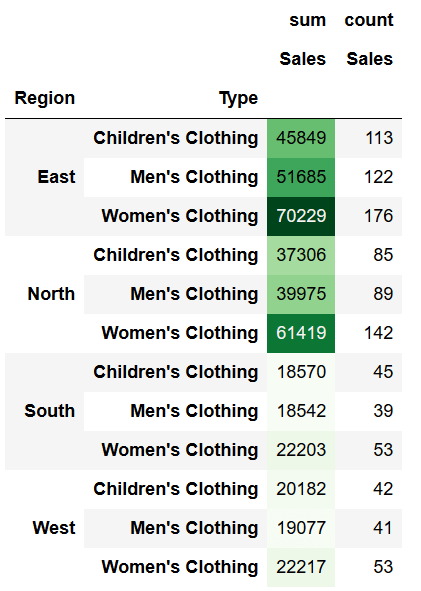
Adding Color Bars to Pandas
Another illustrative way to add context to the size of a value in a column is to add color bars. This is an incredibly easy way to provide visuals that are also easy to print out. We can accomplish this using Python by using the code below:
pivot.style.format({'Sales':'${0:,.0f}'}).bar(color='Green')This returns the following dataframe:
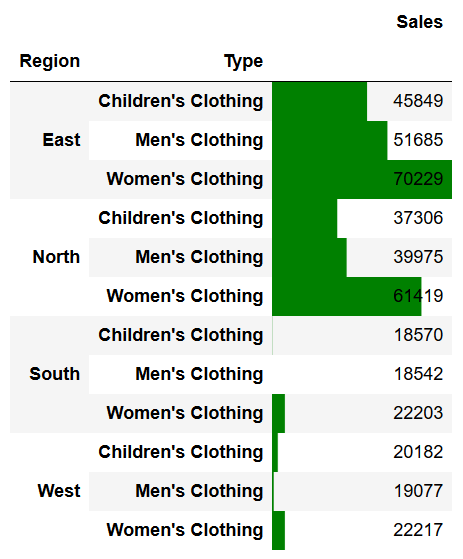
Color bars allow us to see the scale more easily. We can also use the align=center parameter, to have the bars show on the left if values are negative and on the right if they are positive.
How to Reuse Styles in Pandas
After you’ve spent some time creating a style you really like, you may want to reuse it. Thankfully, Pandas makes it easy without having to duplicate the code you meticulously created. You use the .use method on the Style object of another datagram. For example, if we have two dataframes, style1 and style 2, we can reuse the style of style1 by using the following:
style1.style.format({'Sales':'${0:,.0f}'}).bar(color='Green')
style2.use(style1.export())
Hiding Index or Columns
Since we’re talking about getting data ready for displaying, let’s talk about another piece that Excel makes quite easy: hiding columns. We can accomplish this in Pandas using styler objects as well. If we wanted to hide the index, we could write:
df.head().style.hide_index()Date Region Type Units Sales
2020-07-11 00:00:00 East Children's Clothing 18.000000 306
2020-09-23 00:00:00 North Children's Clothing 14.000000 448
2020-04-02 00:00:00 South Women's Clothing 17.000000 425
2020-02-28 00:00:00 East Children's Clothing 26.000000 832
2020-03-19 00:00:00 West Women's Clothing 3.000000 33Similarly, if we wanted to hide a column, we could write:
df.head().style.hide_columns(['Units']) Date Region Type Sales
0 2020-07-11 00:00:00 East Children's Clothing 306
1 2020-09-23 00:00:00 North Children's Clothing 448
2 2020-04-02 00:00:00 South Women's Clothing 425
3 2020-02-28 00:00:00 East Children's Clothing 832
4 2020-03-19 00:00:00 West Women's Clothing 33Exporting Styled Dataframes to Excel
I mentioned earlier in the article that the Style API is Pandas is still experimental. We can’t export all of these methods currently, but can currently export background-color and color. For example, if we wanted to export the following dataframe:
pivot.style.bar(color='Green')We could use the .to_excel method to extract our styled dataframe to an Excel workbook:
pivot.style.background_gradient(cmap='Greens').to_excel('Styled_Dataframe.xlsx', engine='openpyxl')Maybe Just Use Excel?
Finally, there may just be instances where taking your data to Excel could end up being more efficient. In that case, you can just use the df.to_clipboard() method to copy your entire dataframe to your clipboard!
df.to_clipboard()Conclusion: Exploring the Pandas Style API
In this post, we learned how to style a Pandas dataframe using the Pandas Style API. We learned how to add data type styles, conditional formatting, color scales and color bars. Similar to the styles found in Excel, Pandas makes it easy to apply styling to dataframes. This allows us to better represent data and find trends within the data visually.
Pingback: Python: Reverse a String (6 Easy Ways) • datagy
Pingback: Python: Find an Index (or all) of a Substring in a String • datagy
Pingback: Python: How to Get the Last Item (or Last n Items) From a List • datagy
Pingback: Python Square Root: How to Calculate a Square Root in Python • datagy
Pingback: Python Natural Log: Calculate ln in Python • datagy
Pingback: Get Pandas Column Names as a List • datagy
Pingback: VLOOKUP in Python and Pandas using .map() or .merge() • datagy
Pingback: Python: Remove Special Characters from a String • datagy
Pingback: Python e: Python Euler's Constant with Math • datagy
Pingback: Python SHA256 Hashing Algorithm: Explained • datagy
Pingback: Python rfind: Find Index of Last Substring in String • datagy
Pingback: Remove an Item from a Python List (pop, remove, del, clear) • datagy
Pingback: Pandas Rank Function: Rank Dataframe Data (SQL row_number Equivalent) • datagy
Pingback: Numpy Dot Product: Calculate the Python Dot Product • datagy
Pingback: 4 Ways to Clear a Python List • datagy
Pingback: Pandas: Get the Row Number from a Dataframe • datagy
Pingback: 3 Ways to Swap Variables in Python • datagy
This is wonderful. The simple but very informative scripts enthrall me.
Thank you so much!
That was very useful, thanks. Do you happen to know how to unit test a styler object, e.g. check that particular row data has background red applied?
Thanks!
That’s a very interesting question! I don’t know off-hand but I’ll give it some thought :).
Lovin this Nik.
Despite LibreOffice and Calc not working with string format.
Can Panda styles & format do Fonts and other cell formatting?
Thanks
Thanks Ari! You can use CSS-style formatting for customize fonts. It’s a bit tricky, but it works: https://pandas.pydata.org/docs/reference/api/pandas.io.formats.style.Styler.format.html