The Pandas groupby method is an incredibly powerful tool to help you gain effective and impactful insight into your dataset. In just a few, easy to understand lines of code, you can aggregate your data in incredibly straightforward and powerful ways.
By the end of this tutorial, you’ll have learned how the Pandas .groupby() method works by using split-apply-combine. This process efficiently handles large datasets to manipulate data in incredibly powerful ways. You’ll learn how to master the method from end to end, including accessing groups, transforming data, and generating derivative data.
Table of Contents
What is the Pandas GroupBy Method?
The Pandas .groupby() method works in a very similar way to the SQL GROUP BY statement. In fact, it’s designed to mirror its SQL counterpart leverage its efficiencies and intuitiveness. Similar to the SQL GROUP BY statement, the Pandas method works by splitting our data, aggregating it in a given way (or ways), and re-combining the data in a meaningful way.
Because the .groupby() method works by first splitting the data, we can actually work with the groups directly. Similarly, because any aggregations are done following the splitting, we have full reign over how we aggregate the data. Pandas then handles how the data are combined in order to present a meaningful DataFrame.
What’s great about this is that it allows us to use the method in a variety of ways, especially in creative ways. Because of this, the method is a cornerstone to understanding how Pandas can be used to manipulate and analyze data. This tutorial’s length reflects that complexity and importance!
Why Does Pandas Offer Multiple Ways to Aggregate Data?
Pandas seems to provide a myriad of options to help you analyze and aggregate our data. Why would there be, what often seem to be, overlapping method? The answer is that each method, such as using the .pivot(), .pivot_table(), .groupby() methods, provide a unique spin on how data are aggregated. They’re not simply repackaged, but rather represent helpful ways to accomplish different tasks.
Loading a Sample Pandas DataFrame
In order to follow along with this tutorial, let’s load a sample Pandas DataFrame. Let’s load in some imaginary sales data using a dataset hosted on the datagy Github page. If you want to follow along line by line, copy the code below to load the dataset using the .read_csv() method:
# Loading a Sample Pandas DataFrame
import pandas as pd
df = pd.read_csv('https://raw.githubusercontent.com/datagy/data/main/sales.csv', parse_dates=['date'])
print(df.head())

# Returns:
#         date  gender      region  sales
# 0 2022-08-22    Male  North-West  20381
# 1 2022-03-05    Male  North-East  14495
# 2 2022-02-09    Male  North-East  13510
# 3 2022-06-22    Male  North-East  15983
# 4 2022-08-10  Female  North-West  15007
By printing out the first five rows using the .head() method, we can get a bit of insight into our data. We can see that we have a date column that contains the date of a transaction. We have string type columns covering the gender and the region of our salesperson. Finally, we have an integer column, sales, representing the total sales value.
Understanding Pandas GroupBy Objects
Let’s take a first look at the Pandas .groupby() method. We can create a GroupBy object by applying the method to our DataFrame and passing in either a column or a list of columns. Let’s see what this looks like – we’ll create a GroupBy object and print it out:
# Creating a Pandas GroupBy Object
print(df.groupby('region'))

# Returns: <pandas.core.groupby.generic.DataFrameGroupBy object at 0x7fb78815a4f0>
We can see that this returned an object of type DataFrameGroupBy. Because it’s an object, we can explore some of its attributes.
Pandas GroupBy Attributes
For example, these objects come with an attribute, .ngroups, which holds the number of groups available in that grouping:
# Counting the Groups in a Pandas GroupBy Object
print(df.groupby('region').ngroups)

# Returns: 3
We can see that our object has 3 groups. Similarly, we can use the .groups attribute to gain insight into the specifics of the resulting groups. The output of this attribute is a dictionary-like object, which contains our groups as keys. The values of these keys are actually the indices of the rows belonging to that group!
# Accessing the Groups in a GroupBy object
print(df.groupby('region').groups)

# Returns: (truncated)
# {'North-East': [1, 2, 3, ...], 'North-West': [0, 4, 7, ...], 'South': [5, 6, 8, ...]}
If we only wanted to see the group names of our GroupBy object, we could simply return only the keys of this dictionary.
# Accessing only Group Names of a GroupBy Object
print(df.groupby('region').groups.keys())

# Returns: dict_keys(['North-East', 'North-West', 'South'])
We can see how useful this method already is! It allows us to group our data in a meaningful way
Selecting a Pandas GroupBy Group
We can also select particular all the records belonging to a particular group. This can be useful when you want to see the data of each group. In order to do this, we can apply the .get_group() method and passing in the group’s name that we want to select. Let’s try and select the 'South' region from our GroupBy object:
# Selecting a Pandas GroupBy Group
print(df.groupby('region').get_group('South'))

# Returns:
#           date  gender region  sales
# 5   2022-09-06    Male  South  21792
# 6   2022-08-21    Male  South  20113
# 8   2022-11-22    Male  South  14594
# 9   2022-01-16  Female  South  24114
# 10  2022-12-21    Male  South  35154
# ..         ...     ...    ...    ...
# 972 2022-06-09    Male  South  22254
# 979 2022-11-24  Female  South  25591
# 981 2022-12-05    Male  South  34334
# 985 2022-12-01  Female  South  21282
# 994 2022-09-29    Male  South  21255

# [331 rows x 4 columns]
This can be quite helpful if you want to gain a bit of insight into the data. Similarly, it gives you insight into how the .groupby() method is actually used in terms of aggregating data. In the following section, you’ll learn how the Pandas groupby method works by using the split, apply, and combine methodology.
Understanding Pandas GroupBy Split-Apply-Combine
The Pandas groupby method uses a process known as split, apply, and combine to provide useful aggregations or modifications to your DataFrame. This process works as just as its called:
- Splitting the data into groups based on some criteria
- Applying a function to each group independently
- Combing the results into an appropriate data structure
In the section above, when you applied the .groupby() method and passed in a column, you already completed the first step! You were able to split the data into relevant groups, based on the criteria you passed in.
The reason for applying this method is to break a big data analysis problem into manageable parts. This allows you to perform operations on the individual parts and put them back together. While the apply and combine steps occur separately, Pandas abstracts this and makes it appear as though it was a single step.
Using Split-Apply-Combine Without GroupBy
Before we dive into how the .groupby() method works, lets take a look at how we can replicate it without the use of the function. The benefit of this approach is that we can easily understand each step of the process.
- Splitting the data: Let’s begin by splitting the data – we can loop over each unique value in the DataFrame, splitting the data by the
'region'column. - Applying a aggregation function: From there, we can select the rows from the DataFrame that meet the condition and apply a function to it.
- Combining the Data: Finally, we can create a dictionary and add data to it and turn it back into a Pandas DataFrame.
# Replicating split-apply-combine Without GroupBy

# Create a Container Dictionary
averages = {}

# Split the data into different regions
for region in df['region'].unique():
    tempdf = df[df['region'] == region]

    # Apply an aggregation function
    average = tempdf['sales'].mean()

    # Combine the data into a DataFrame
    averages[region] = [average]

aggregate_df = pd.DataFrame.from_dict(averages, orient='index', columns=['Average Sales'])
print(aggregate_df)

# Returns:
#             Average Sales
# North-West   15257.732919
# North-East   17386.072046
# South        24466.864048
This is a lot of code to write for a simple aggregation! Thankfully, the Pandas groupby method makes this much, much easier. In the next section, you’ll learn how to simplify this process tremendously.
Aggregating Data with Pandas GroupBy
In this section, you’ll learn how to use the Pandas groupby method to aggregate data in different ways. We’ll try and recreate the same result as you learned about above in order to see how much simpler the process actually is! Let’s take a look at what the code looks like and then break down how it works:
# Aggregating Data with Pandas .groupby()
averages = df.groupby('region')['sales'].mean()
print(averages)

# Returns:
# region
# North-East    17386.072046
# North-West    15257.732919
# South         24466.864048
# Name: sales, dtype: float64
Take a look at the code! We were able to reduce six lines of code into a single line! Let’s break this down element by element:
df.groupby('region')is familiar to you by now. It splits the data into different groups, based on theregioncolumn['sales']selects only that column from the groupings.mean()applies the mean method to the column in each group- The data are combined into the resulting DataFrame,
averages
Let’s take a look at the entire process a little more visually. In order to make it easier to understand visually, let’s only look at the first seven records of the DataFrame:
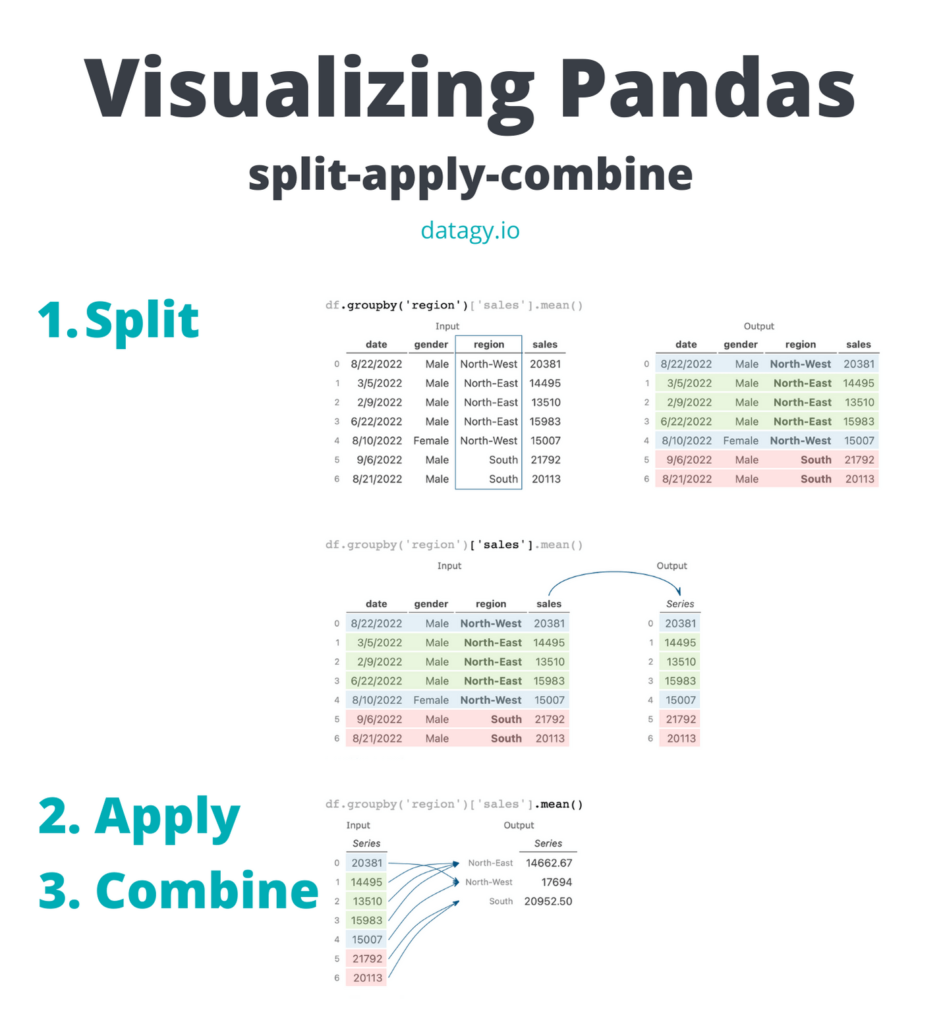
.groupby()In the image above, you can see how the data is first split into groups and a column is selected, then an aggregation is applied and the resulting data are combined.
Other Aggregations with Pandas GroupBy
Now that you understand how the split-apply-combine procedure works, let’s take a look at some other aggregations work in Pandas. The table below provides an overview of the different aggregation functions that are available:
| Aggregation Method | Description |
|---|---|
.count() | The number of non-null records |
.sum() | The sum of the values |
.mean() | The arithmetic mean of the values |
.median() | The median of the values |
.min() | The minimum value of the group |
.max() | The maximum value of the group |
.mode() | The most frequent value in the group |
.std() | The standard deviation of the group |
.var() | The variance of the group |
.groupby()For example, if we wanted to calculate the standard deviation of each group, we could simply write:
# Calculating the Standard Deviation of Each Group's Sales
standard_deviations = df.groupby('region')['sales'].std()
print(standard_deviations)

# Returns:
# region
# North-East    2032.541552
# North-West    3621.456493
# South         5253.702513
# Name: sales, dtype: float64
Applying Multiple Aggregations Using Pandas GroupBy
Pandas also comes with an additional method, .agg(), which allows us to apply multiple aggregations in the .groupby() method. The method allows us to pass in a list of callables (i.e., the function part without the parentheses). Let’s see how we can apply some of the functions that come with the numpy library to aggregate our data.
# Applying Multiple Aggregations with .agg()
import numpy as np
aggs = df.groupby('region')['sales'].agg([np.mean, np.std, np.var])
print(aggs)

# Returns:
#                     mean          std           var
# region
# North-East  17386.072046  2032.541552  4.131225e+06
# North-West  15257.732919  3621.456493  1.311495e+07
# South       24466.864048  5253.702513  2.760139e+07
Using the .agg() method allows us to easily generate summary statistics based on our different groups. Without this, we would need to apply the .groupby() method three times but here we were able tor reduce it down to a single method call!
Transforming Data with Pandas GroupBy
Another incredibly helpful way you can leverage the Pandas groupby method is to transform your data. What does this mean? By transforming your data, you perform some operation-specific to that group. This can include, for example, standardizing the data based only on that group using a z-score or dealing with missing data by imputing a value based on that group.
What makes the transformation operation different from both aggregation and filtering using .groupby() is that the resulting DataFrame will be the same dimensions as the original data. While this can be true for aggregating and filtering data, it is always true for transforming data.
The .transform() method will return a single value for each record in the original dataset. Because of this, the shape is guaranteed to result in the same size.
Using .transform In GroupBy
Let’s take a look at an example of transforming data in a Pandas DataFrame. In this example, we’ll calculate the percentage of each region’s total sales is represented by each sale. In order to do this, we can apply the .transform() method to the GroupBy object. We can pass in the 'sum' callable to return the sum for the entire group onto each row. Finally, we divide the original 'sales' column by that sum.
Let’s see what this code looks like:
# Calculating percentage of region's sales
df['Percent Of Region Sales'] = df['sales'] / df.groupby('region')['sales'].transform('sum')
print(df.head())

# Returns:
#         date  gender      region  sales  Percent Of Region Sales
# 0 2022-08-22    Male  North-West  20381                 0.004148
# 1 2022-03-05    Male  North-East  14495                 0.002403
# 2 2022-02-09    Male  North-East  13510                 0.002239
# 3 2022-06-22    Male  North-East  15983                 0.002649
# 4 2022-08-10  Female  North-West  15007                 0.003055
In the resulting DataFrame, we can see how much each sale accounted for out of the region’s total.
Transforming Data without .transform
While in the previous section, you transformed the data using the .transform() function, we can also apply a function that will return a single value without aggregating. As an example, let’s apply the .rank() method to our grouping. This will allow us to, well, rank our values in each group. Rather than using the .transform() method, we’ll apply the .rank() method directly:
# Transforming a DataFrame with GroupBy
df['ranked'] = df.groupby('region')['sales'].rank(ascending=False)
print(df.sort_values(by='sales', ascending=False).head())

# Returns:
#           date  gender region  sales  ranked
# 61  2022-02-22  Female  South  43775     1.0
# 673 2022-04-19    Male  South  37878     2.0
# 111 2022-10-31  Female  South  36444     3.0
# 892 2022-09-05    Male  South  35723     4.0
# 136 2022-02-27    Male  South  35485     5.0
In this case, the .groupby() method returns a Pandas Series of the same length as the original DataFrame. Because of this, we can simply assign the Series to a new column.
Filtering Data with Pandas GroupBy
A great way to make use of the .groupby() method is to filter a DataFrame. This approach works quite differently from a normal filter since you can apply the filtering method based on some aggregation of a group’s values. For example, we can filter our DataFrame to remove rows where the group’s average sale price is less than 20,000.
# Filtering Rows Where the Group's Average Sale Price is Less Than 20,000
df = df.groupby('region').filter(lambda x: x['sales'].mean() < 20000)
print(df.head())

# Returns:
#         date  gender      region  sales
# 0 2022-08-22    Male  North-West  20381
# 1 2022-03-05    Male  North-East  14495
# 2 2022-02-09    Male  North-East  13510
# 3 2022-06-22    Male  North-East  15983
# 4 2022-08-10  Female  North-West  15007
Let’s break down how this works:
- We group our data by the
'region'column - We apply the
.filter()method to filter based on a lambda function that we pass in - The lambda function evaluates whether the average value found in the group for the
'sales'column is less than 20,000
This approach saves us the trouble of first determining the average value for each group and then filtering these values out. In this example, the approach may seem a bit unnecessary. However, it opens up massive potential when working with smaller groups.
Grouping a Pandas DataFrame by Multiple Columns
We can extend the functionality of the Pandas .groupby() method even further by grouping our data by multiple columns. So far, you’ve grouped the DataFrame only by a single column, by passing in a string representing the column. However, you can also pass in a list of strings that represent the different columns. By doing this, we can split our data even further.
Let’s calculate the sum of all sales broken out by 'region' and by 'gender' by writing the code below:
# Grouping Data by Multiple Columns
sums = df.groupby(['region', 'gender'])['sales'].sum()
print(sums.head())

# Returns:
#                      sales
# region     gender
# North-East Female  3051132
#            Male    2981835
# North-West Female  2455899
#            Male    2457091
# South      Female  4135688
What’s more, is that all the methods that we previously covered are possible in this regard as well. For example, we could apply the .rank() function here again and identify the top sales in each region-gender combination:
# Ranking Sales by Region and by Gender
df['rank'] = df.groupby(['region', 'gender'])['sales'].rank(ascending=False)
print(df.head())

# Returns:
#         date  gender      region  sales   rank
# 0 2022-08-22    Male  North-West  20381   11.0
# 1 2022-03-05    Male  North-East  14495  154.0
# 2 2022-02-09    Male  North-East  13510  168.0
# 3 2022-06-22    Male  North-East  15983  138.0
# 4 2022-08-10  Female  North-West  15007   89.5
Using Custom Functions with Pandas GroupBy
Another excellent feature of the Pandas .groupby() method is that we can even apply our own functions. This allows us to define functions that are specific to the needs of our analysis. You’ve actually already seen this in the example to filter using the .groupby() method. We can either use an anonymous lambda function or we can first define a function and apply it.
Let’s take a look at how this can work. We can define a custom function that will return the range of a group by calculating the difference between the minimum and the maximum values. Let’s define this function and then apply it to our .groupby() method call:
# Using a User-Defined Function in a GroupBy Object
def group_range(x):
    return x.max() - x.min()

ranges = df.groupby(['region', 'gender'])['sales'].apply(group_range)
print(ranges)

# Returns:
# region      gender
# North-East  Female    10881
#             Male      10352
# North-West  Female    20410
#             Male      17469
# South       Female    30835
#             Male      27110
# Name: sales, dtype: int64
The group_range() function takes a single parameter, which in this case is the Series of our 'sales' groupings. We find the largest and smallest values and return the difference between the two. This can be helpful to see how different groups’ ranges differ.
Useful Examples of Pandas GroupBy
In this section, you’ll learn some helpful use cases of the Pandas .groupby() method. The examples in this section are meant to represent more creative uses of the method. These examples are meant to spark creativity and open your eyes to different ways in which you can use the method.
Getting the First n Rows of a Pandas GroupBy
Let’s take a look at how you can return the five rows of each group into a resulting DataFrame. This can be particularly helpful when you want to get a sense of what the data might look like in each group. If it doesn’t matter how the data are sorted in the DataFrame, then you can simply pass in the .head() function to return any number of records from each group.
Let’s take a look at how to return two records from each group, where each group is defined by the region and gender:
# Return the first two records of each group
print(df.groupby(['region', 'gender']).head(2))

# Returns:
#          date  gender      region  sales
# 0  2022-08-22    Male  North-West  20381
# 1  2022-03-05    Male  North-East  14495
# 2  2022-02-09    Male  North-East  13510
# 4  2022-08-10  Female  North-West  15007
# 5  2022-09-06    Male       South  21792
# 6  2022-08-21    Male       South  20113
# 7  2022-07-08    Male  North-West  13650
# 9  2022-01-16  Female       South  24114
# 11 2022-04-30  Female  North-West  19631
# 12 2022-11-25  Female  North-East  18262
# 13 2022-08-14  Female  North-East  13733
# 20 2022-01-21  Female       South  32313
Getting the nth Largest Row of a Pandas GroupBy
In this example, you’ll learn how to select the nth largest value in a given group. For this, we can use the .nlargest() method which will return the largest value of position n. For example, if we wanted to return the second largest value in each group, we could simply pass in the value 2. Let’s see what this looks like:
# Getting the second largest value in each group
print(df.groupby(['region', 'gender'])['sales'].nlargest(2))

# Returns:
# region      gender
# North-East  Female  407    22545
#                     561    21933
#             Male    560    22361
#                     442    21951
# North-West  Female  758    26813
#                     46     24573
#             Male    844    23553
#                     576    23485
# South       Female  61     43775
#                     111    36444
#             Male    673    37878
#                     892    35723
# Name: sales, dtype: int64
Exercises
It’s time to check your learning! Use the exercises below to practice using the .groupby() method. The solutions are provided by toggling the section under each question.
Return a DataFrame containing the minimum value of each region’s dates.
print(df.groupby('region')['date'].min())

# Returns:
# region
# North-East   2022-01-02
# North-West   2022-01-02
# South        2022-01-04
# Name: date, dtype: datetime64[ns]
Which is the smallest standard deviation of sales?
print(df.groupby('region')['sales'].std().min())
# Returns: 2032.5415517362096
How would you return the last 2 rows of each group of region and gender?
print(df.groupby(['region', 'gender']).tail(2))

# Returns:
#           date  gender      region  sales
# 979 2022-11-24  Female       South  25591
# 981 2022-12-05    Male       South  34334
# 985 2022-12-01  Female       South  21282
# 988 2022-07-10    Male  North-West  12500
# 990 2022-07-07  Female  North-East  16468
# 993 2022-06-11    Male  North-West  14942
# 994 2022-09-29    Male       South  21255
# 995 2022-06-02  Female  North-West  14015
# 996 2022-05-20  Female  North-East  15503
# 997 2022-04-02    Male  North-East  18714
# 998 2022-12-07    Male  North-East  19910
# 999 2022-12-19  Female  North-West  16589
Conclusion and Recap
In this tutorial, you learned about the Pandas .groupby() method. The method allows you to analyze, aggregate, filter, and transform your data in many useful ways. Below, you’ll find a quick recap of the Pandas .groupby() method:
- The Pandas
.groupby()method allows you to aggregate, transform, and filter DataFrames - The method works by using split, transform, and apply operations
- You can group data by multiple columns by passing in a list of columns
- You can easily apply multiple aggregations by applying the
.agg()method - You can use the method to transform your data in useful ways, such as calculating z-scores or ranking your data across different groups
The official documentation for the Pandas .groupby() method can be found here.
Additional Resources
To learn more about related topics, check out the tutorials below:
Pingback: Creating Pivot Tables in Pandas with Python for Python and Pandas • datagy
Pingback: Pandas Value_counts to Count Unique Values • datagy
Pingback: Binning Data in Pandas with cut and qcut • datagy
thank you for your great explanation
Thanks Laurent!
That is wonderful explanation … really appreciated
Thanks Abdelghany!
Great tutorial like always!
I would just add an example with firstly using sort_values, then groupby(), for example this line:
df.sort_values(by=’sales’).groupby([‘region’, ‘gender’]).head(2)
That’s awesome! Thanks for adding this!
Hello, Question 2 is not formatted to copy/paste/run. It gives a SyntaxError: invalid character ‘‘’ (U+2018).
Thanks! I have fixed this issue.
sums = df.groupby([‘region’, ‘gender’]).sum()
print(sums.head())
TypeError: datetime64 type does not support sum operations
maybe ?
sums = df.groupby([‘region’, ‘gender’])[‘sales’].sum()
print(sums.head())
Hi Konst, Thanks so much! I have updated the post.