
In this tutorial, you’ll learn how to use Pandas to count unique values in a groupby object. The Pandas .groupby() method is an essential tool in your data analysis toolkit, allowing you to easily split your data into different groups and perform different aggregations to each group.
By the end of this tutorial, you’ll have learned how to count unique values in a Pandas groupby object, using the incredibly useful .nunique() Pandas method. If you only want to find unique values, check out how to use the Pandas unique method.
The Quick Answer: Use .nunique() to Count Unique Values in a Pandas GroupBy Object
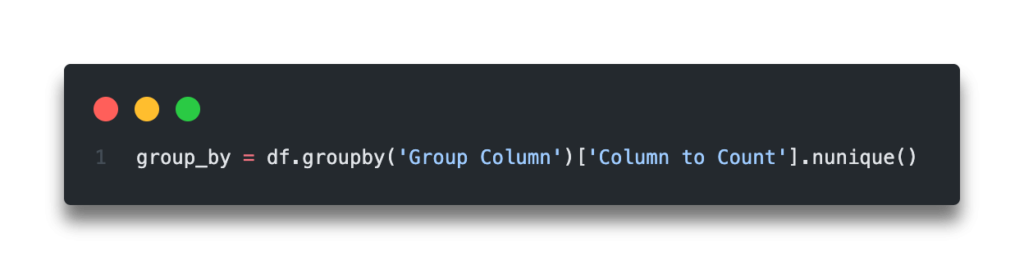
Table of Contents
Loading a Sample Dataframe
If you want to follow along with this tutorial, feel free to load the sample dataframe provided below by simply copying and pasting the code into your favourite code editor.
Let’s dive right in:
import pandas as pd

df = pd.read_csv('https://raw.githubusercontent.com/fivethirtyeight/data/master/college-majors/women-stem.csv')

print(df.head())
This returns the following dataframe:
#   Rank  Major_code                                      Major Major_category  Total   Men  Women  ShareWomen  Median
# 0     1        2419                      PETROLEUM ENGINEERING    Engineering   2339  2057    282    0.120564  110000
# 1     2        2416             MINING AND MINERAL ENGINEERING    Engineering    756   679     77    0.101852   75000
# 2     3        2415                  METALLURGICAL ENGINEERING    Engineering    856   725    131    0.153037   73000
# 3     4        2417  NAVAL ARCHITECTURE AND MARINE ENGINEERING    Engineering   1258  1123    135    0.107313   70000
# 4     5        2418                        NUCLEAR ENGINEERING    Engineering   2573  2200    373    0.144967   65000
This dataset is provided by FiveThirtyEight and provides information on women’s representation across different STEM majors.
Understanding Pandas GroupBy
Before we dive into how to use Pandas .groupby() to count unique values in a group, let’s explore how the .groupby() method actually works. This will allow you to understand why this solution works, allowing you to apply it to different scenarios more easily. The method is incredibly versatile and fast, allowing you to answer relatively complex questions with ease.
The Pandas .groupby()works in three parts:
- Split – split the data into different groups
- Apply – apply some form of aggregation
- Combine – recombine the data
Let’s see how you can use the .groupby() method to find the maximum of a group, specifically the Major group, with the maximum proportion of women in that group:
# How to use the Pandas .groupby() method
import pandas as pd

df = pd.read_csv('https://raw.githubusercontent.com/fivethirtyeight/data/master/college-majors/women-stem.csv')
group_by = df.groupby('Major_category')['ShareWomen'].max()

print(group_by.head())
This returns the following:
# Major_category
# Biology & Life Science     0.707719
# Computers & Mathematics    0.526476
# Engineering                0.451465
# Health                     0.967998
# Physical Sciences          0.750473
# Name: ShareWomen, dtype: float64
Now that you know how to use the Pandas .groupby() method, let’s see how we can use the method to count the number of unique values in each group.
To learn more about the Pandas .groupby() method, check out my in-depth tutorial here:
Pandas: Count Unique Values in a GroupBy Object
Let’s learn how you can count the number of unique values in a Pandas groupby object. Similar to the example shown above, you’re able to apply a particular transformation to a group.
In order to do this, we can use the helpful Pandas .nunique() method, which allows us to easily count the number of unique values in a given segment.
Let’s see how we can do this with Python and Pandas:
import pandas as pd

df = pd.read_csv('https://raw.githubusercontent.com/fivethirtyeight/data/master/college-majors/women-stem.csv')
group_by = df.groupby('Major_category')['ShareWomen'].nunique()

print(group_by.head())
This returns the following:
Major_category
Biology & Life Science     14
Computers & Mathematics    11
Engineering                29
Health                     12
Physical Sciences          10
Name: ShareWomen, dtype: int64
Let’s see what we’ve done here:
- We first used the
.groupby()method and passed in the Major_category column, indicating we want to split by that column - We then passed in the ShareWomen column to indicate we want the number of unique values for that column
- We then apply the
.nunique()method to count the number of unique values in that column
Conclusion
In this post, you learned how to count the number of unique values in a Pandas group. You learned a little bit about the Pandas .groupby() method and how to use it to aggregate data. Finally, you learned how to use the Pandas .groupby() method to count the number of unique values in each Pandas group.
To learn more about the Pandas groupby method, check out the official documentation here.
Additional Resources
To learn more about related topics, check out the tutorials below:
Pingback: How to Append to a Set in Python: Python Set Add() and Update() • datagy
Pingback: Pandas GroupBy: Group, Summarize, and Aggregate Data in Python