
In this complete guide to using Seaborn to create scatter plots in Python, you’ll learn all you need to know to create scatterplots in Seaborn! Scatterplots are an essential type of data visualization for exploring your data. Being able to effectively create and customize scatter plots in Python will make your data analysis workflow much easier!
By the end of this tutorial, you’ll have learned how to use Seaborn to:
- How to create scatter plots in Python with Seaborn
- How to customize colors, markers, and sizes in Seaborn scatter plots
- How to create 3D scatter plots and add regression lines to scatter plots
- How to add titles and axis labels to your scatter plots
Table of Contents
Understanding the Seaborn scatterplot Function
Before diving into how to create and customize scatterplots in Seaborn, it’s important to understand the scatterplot() function. This allows you to better understand how to use the function and what is possible with it. Let’s take a look at how the function can be used:
# Understanding the Seaborn scatterplot() Function
import seaborn as sns

sns.scatterplot(data=None, x=None, y=None, hue=None, size=None, style=None, palette=None, hue_order=None, hue_norm=None, sizes=None, size_order=None, size_norm=None, markers=True, style_order=None, legend='auto', ax=None)
We can see that the function offers a ton of different parameters.
By making good use of these parameters, we can create incredibly useful visualizations, such as the one shown below:
# What you'll be able to do at the end of this tutorial
import seaborn as sns
import matplotlib.pyplot as plt
df = sns.load_dataset('penguins')

sns.set_style(style='whitegrid')

sns.scatterplot(
    data=df,
    x='bill_length_mm',
    y='bill_depth_mm',
    hue='species',
    style='sex',
    palette='Paired_r'
    )

plt.title('Exploring Physical Attributes of Different Penguins')
plt.xlabel('Bill Length (mm)')
plt.ylabel('Bill Depth (mm)')
plt.legend(bbox_to_anchor=(1.05, 1), loc='upper left', borderaxespad=0)

plt.show()
Which returns the following image:

Let’s explore these parameters to better understand their behavior, including any default arguments that are passed in. The table below breaks down the parameters available in the sns.scatterplot() function:
| Parameter | Description | Default Value | Accepted Values |
|---|---|---|---|
data= | The data structure to use, such as a Pandas DataFrame | None | Pandas DataFrame or NumPy Array |
x= | The variables that specify values on the x axis | None | The vectors or keys in data |
y= | The variables that specify values on the y axis | None | The vectors or keys in data |
hue= | A grouping variable that produces points of different colors (either categorical or numeric) | None | The vectors or keys in data |
size= | A grouping variable that produces points of different size (either categorical or numeric) | None | The vectors or keys in data |
style= | A grouping variable that produces points of different style (either categorical or numeric) | None | The vectors or keys in data |
palette= | The method for choosing the colors to use when mapping | None | string, list, dict or Matplotlib colormap |
hue_order= | The order of processing and plotting for categorical levels of the hue semantic | None | list of strings |
hue_norm= | Either a pair of values that set the normalization range in data units or an object that will map to [0, 1] range | None | tuple or matplotlib Normalize |
sizes= | An object that determines how sizes are chosen | None | list, dict or tuple |
size_order= | The specified order for appearance of the size variable levels. | None | list |
size_norm= | Normalization in data units for scaling plot objects when the size variable is numeric | None | tuple or Normalize object |
markers= | Object determining how to draw markers for different levels of the style variable. | None | boolean, list or dictionary |
style_order= | Specific order for the appearance of the style variable. | None | list |
legend= | How to draw the legend | 'auto' | 'auto', 'brief', 'full', or False |
ax= | The pre-existing axes for the plot. | None | matplotlib Axes |
Seaborn scatterplot() can also be called using sns.relplot()
The sns.scatterplot() function is an axes-level function. If you need to draw figures instead, you can use the sns.relplot() function. This gives you more flexibility in drawing small multiples and controlling figure aesthetics.
How to Create Python Seaborn Scatter Plots
In this section, you’ll learn how to create Seaborn scatterplots using the scatterplot() function. For this tutorial, we’ll use a dataset that gives us enough flexibility to try out many of the different features available in the function. We can use the 'penguins' dataset found in Seaborn to try this out.
Let’s begin by loading the library and the dataset and then creating our first scatterplot:
# Loading the Penguins Dataset
import seaborn as sns
df = sns.load_dataset('penguins')
print(df.info())

# Returns:
# <class 'pandas.core.frame.DataFrame'>
# RangeIndex: 344 entries, 0 to 343
# Data columns (total 7 columns):
#  #   Column             Non-Null Count  Dtype
# ---  ------             --------------  -----
#  0   species            344 non-null    object
#  1   island             344 non-null    object
#  2   bill_length_mm     342 non-null    float64
#  3   bill_depth_mm      342 non-null    float64
#  4   flipper_length_mm  342 non-null    float64
#  5   body_mass_g        342 non-null    float64
#  6   sex                333 non-null    object
# dtypes: float64(4), object(3)
# memory usage: 18.9+ KB
# None
We can see that the dataset comes with a number of different categorical and numerical columns, allowing us to try out a number of different, useful features.
Let’s now use the scatterplot() function to plot bill length and depth against one another:
# Creating Our First Scatterplot
import seaborn as sns
import matplotlib.pyplot as plt
df = sns.load_dataset('penguins')

sns.scatterplot(data=df, x='bill_length_mm', y='bill_depth_mm')
plt.show()
This returns the following image:
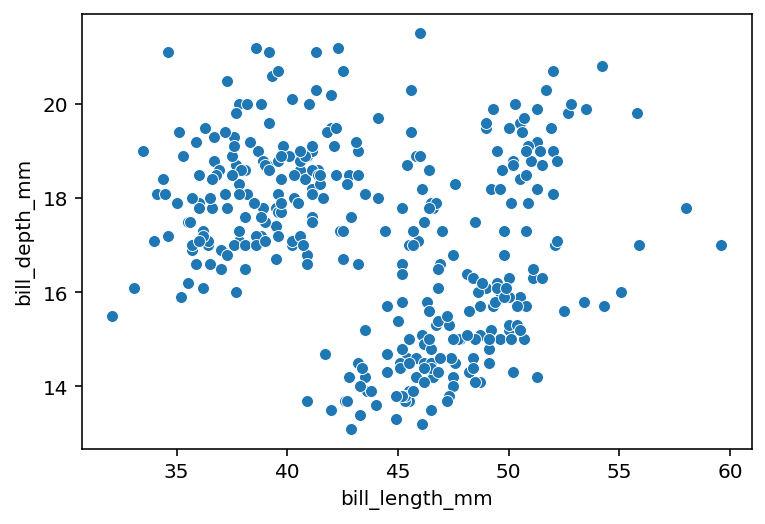
By passing a Pandas DataFrame into the data= parameter, we were able to reference the columns of that DataFrame as strings. This method is declarative and allows us to abstract away from the complexity of working with Series data.
We can create the same scatterplot by writing:
# Alternative Method of Creating a Scatterplot in Seaborn
import seaborn as sns
import matplotlib.pyplot as plt
df = sns.load_dataset('penguins')

sns.scatterplot(x=df['bill_length_mm'], y=df['bill_depth_mm'])
plt.show()
This code generates the same scatterplot. It works by passing in the Series of data that we want to use for creating our visualization, rather than using a declarative method.
In the following section, you’ll learn how to add color to scatterplots in Seaborn.
How to Add Color to Python Seaborn Scatter Plots with Hue
Currently, our scatterplot visualizes the distribution of two different variables. We can add in another variable by using color. This can be done using the hue= parameter, which also accepts the label of a column.
Depending on the type of variable you pass in, you’ll experience different behavior. The hue= parameter allows you to pass in:
- Categorical variables, where each color represents a categorical
- Continuous variables, where the color represents a gradient along the scale
Let’s first load in a categorical variable to see how we add in more dimensionality into our data:
# Adding a Categorical Color to Our Seaborn Scatterplot
import seaborn as sns
import matplotlib.pyplot as plt
df = sns.load_dataset('penguins')

sns.scatterplot(data=df, x='bill_length_mm', y='bill_depth_mm', hue='species')
plt.show()
This returns the following visualization:

Because the data in the 'species' column are categorical, the colors represented in the scatterplot are broken out discretely. We can also see that a legend has been created.
We can also use the hue= parameter to pass in a continuous variable. Let’s see how our visualization changes by passing in the 'body_mass_g' variable:
# Adding a Continuous Color to Our Seaborn Scatterplot
import seaborn as sns
import matplotlib.pyplot as plt
df = sns.load_dataset('penguins')

sns.scatterplot(data=df, x='bill_length_mm', y='bill_depth_mm', hue='body_mass_g')
plt.show()
We can see that by setting a continuous variable as the argument for the hue= parameter, that the following image is returned. The color changes to a gradient where the values move along a certain color map indicating the particular scale of a continuous variable.

In the following image, you’ll learn how to customize the marker size of markers in Seaborn.
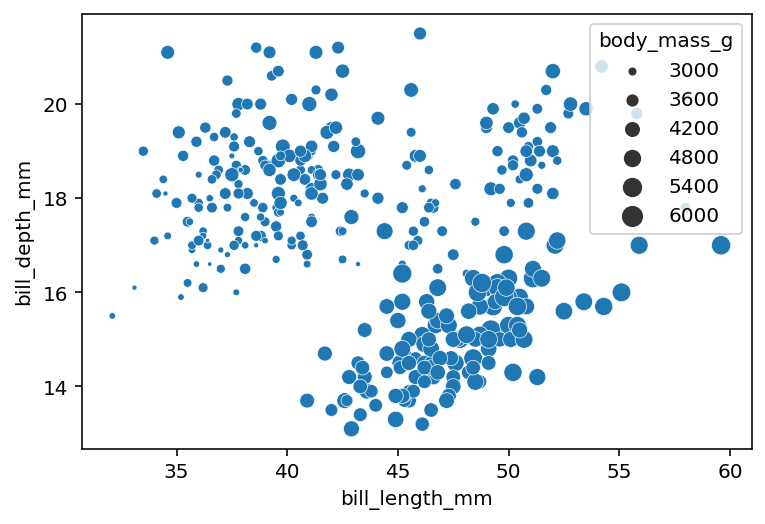
How to Change Marker Size in Python Seaborn Scatter Plots
Seaborn also allows you to customize the size of markers using the size= parameter. By passing in a Pandas DataFrame column label, the sizes of the markers will adjust relative to the values in the column. Let’s see what this looks like:
# Adjusting the Marker Size in Seaborn Scatterplots
import seaborn as sns
import matplotlib.pyplot as plt
df = sns.load_dataset('penguins')

sns.scatterplot(data=df, x='bill_length_mm', y='bill_depth_mm', size='body_mass_g')
plt.show()
This returns the following image:

We can see that the that marker sizes don’t show too much a difference. Seaborn allows us to define the relative sizes of the by passing in a tuple of sizes into the sizes= parameter. This allows us to pass in the minimum and maximum sizes, as shown below:
# Specifying the Size Ranges of Markers in Seaborn Scatterplots
import seaborn as sns
import matplotlib.pyplot as plt
df = sns.load_dataset('penguins')

sns.scatterplot(data=df, x='bill_length_mm', y='bill_depth_mm', size='body_mass_g', sizes=(1,100))
plt.show()
This returns the following image:
In the following section, you’ll learn how to change markers in Seaborn scatter plots.
How to Change Markers in Python Seaborn Scatter Plots
Similar to modifying the color of markers in the scatter plots, we can modify the actual markers themselves. This has the added benefit of being more accessible and allowing you to print the visualizations in black and white.
We can do this by passing in a variable into the style= parameter. This can also be combined with the hue= parameter you learned about previously. This way, the variables will be colored and styles differently, allowing for better accessibility.
# Changing Marker Style in Seaborn
import seaborn as sns
import matplotlib.pyplot as plt
df = sns.load_dataset('penguins')

sns.scatterplot(data=df, x='bill_length_mm', y='bill_depth_mm', style='species', hue='species')
plt.show()
This returns the following image:

We can see that this makes the resulting visualization much more accessible, especially for those who are color blind.
How to Add a Line to Python Seaborn Scatter Plots
By adding a line to a Seaborn scatterplot, you can visualize different regression trends between two variables. Because we’re really looking at analyzing the relationship between two variables from a standpoint of regression, we use the lmplot() function instead.
Let’s see how we can compare the bill length and depth and display a regression line in Seaborn:
# Adding a Regression Line to a Seaborn Scatter Plot
import seaborn as sns
import matplotlib.pyplot as plt
df = sns.load_dataset('penguins')

sns.lmplot(data=df, x='bill_length_mm', y='bill_depth_mm')
plt.show()
This returns the following image:

In the following section, you’ll learn how to create 3D scatterplots in Seaborn.
How to Make 3D Scatterplots in Python Seaborn
In this section, you’ll learn how to create 3D scatter plots. Because Seaborn is built on top of Matplotlib, we can access many of the important aspects of the library. To learn about this process in more depth, check out my complete tutorial on create 3D scatter plots in Python with Seaborn and Matplotlib.
# Creating a 3D Scatter Plot in Python
import seaborn as sns
import matplotlib.pyplot as plt
from mpl_toolkits import mplot3d

fig = plt.figure()
ax = plt.axes(projection='3d')

df = sns.load_dataset('penguins')
x=df['bill_length_mm']
y=df['bill_depth_mm']
z=df['body_mass_g']

ax.scatter(x, y, z)
plt.show()
In the code above, we:
- Imported
mpl_toolkitsto be able to project onto 3D axes - We then declared a fig and ax object in order to specify that we want to create a 3D projection
- Then, we defined our x, y, and z variables and loaded them into the Matplotlib
scatter()function
This returns the following image:

In the following section, you’ll learn how to add multiple scatterplots in Python Seaborn.
Adding Multiple Scatterplots in Python Seaborn Using Facetgrid
We can use the Seaborn FacetGrid to add multiple scatterplots in Seaborn. This allows you to easily break out scatter plots across multiple variables. This means that you can better visualize how different elements are spread across variables.
Let’s see how we can use the Seaborn FacetGrid to plot multiple scatter plots:
# Using FacetGrid to Add Multiple Scatter Plots in Seaborn
import seaborn as sns
import matplotlib.pyplot as plt
df = sns.load_dataset('penguins')

facet_grid = sns.FacetGrid(data=df, col='species', row='sex')
facet_grid.map(sns.scatterplot, 'bill_depth_mm', 'bill_length_mm')

plt.show()
This returns the following image:

In the following section, you’ll learn how to add a title to a Seaborn scatter plot.
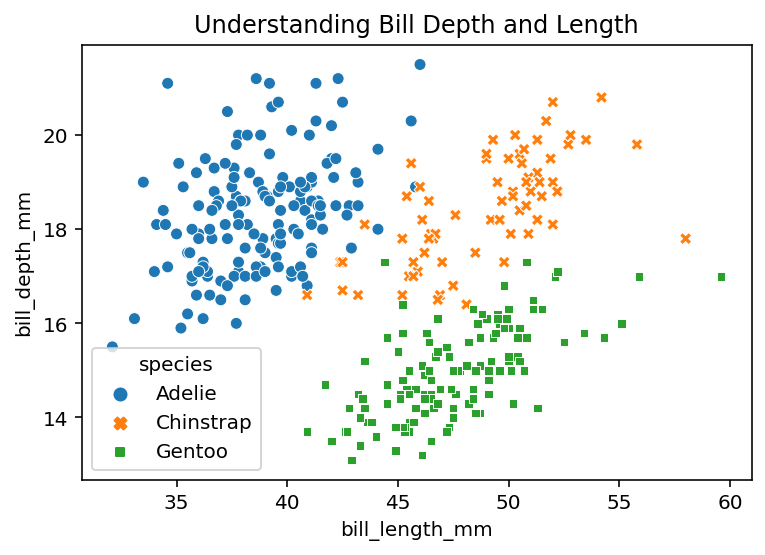
How to Add a Title to a Python Seaborn Scatter Plots
Because Seaborn uses Matplotlib under the hood, we can use different features of Matplotlib to customize our visualizations. For example, we can add a title using Matplotlib. This can be done using the .title() function, as shown below:
# Adding a Title to a Seaborn Scatterplot
import seaborn as sns
import matplotlib.pyplot as plt
df = sns.load_dataset('penguins')

sns.scatterplot(data=df, x='bill_length_mm', y='bill_depth_mm', style='species', hue='species')
plt.title('Understanding Bill Depth and Length')
plt.show()
This returns the following image:
In the following section, you’ll learn how to add axis labels to a Seaborn scatter plot.
How to Add Labels to Python Seaborn Scatter Plots
Similar to adding a title to a Seaborn plot, we can use Matplotlib to add x-axis and y-axis labels. This can be done using the plt.xlabel() and plt.ylabel() functions respectively.
Let’s see how we can add axis labels to our plot:
# Adding Axis Labels to Our Seaborn Scatterplot
import seaborn as sns
import matplotlib.pyplot as plt
df = sns.load_dataset('penguins')

sns.scatterplot(data=df, x='bill_length_mm', y='bill_depth_mm', style='species', hue='species')
plt.xlabel('Bill Length (mm)')
plt.ylabel('Bill Depth (mm)')
plt.show()
This returns the following image:

Conclusion
In this post, you learned how to use Seaborn to create scatterplots. You first learned how to use the function to create simple scatterplots and how to use the function to customize every aspect of your visualization. You then learned how to modify colors, sizes and markers in your plots. You also learned how to create 3D scatterplots and how to add a regression line.
Additional Resources
To learn more about related topics, check out the tutorials below:
- Seaborn relplot – Creating Scatterplots and Lineplots
- Seaborn lineplot – Create Line Plots with Seaborn
- Creating Pair Plots in Seaborn with sns pairplot
- Seaborn Boxplot – How to Create Box and Whisker Plots
- Seaborn Barplot – Make Bar Charts with sns.barplot
- Official Documentation: Seaborn Scatter Plots