
Seaborn is a Python library that allows you to make statistical visualizations. Under the hood, it uses Matplotlib and has significant integration with the Pandas data analysis library. The legend in Seaborn is a box that provides descriptions of the different attributes of the graph, including which colors represent which attributes.
In this tutorial, you’ll learn how to create and customize Seaborn legends, including the position, size, labels, and title. Because Seaborn uses Matplotlib under the hood, you get plenty of customization options when it comes to your legend.
By the end of this tutorial, you’ll have learned the following:
- How to add or hide a legend in Seaborn
- How to move the legend in Seaborn to different positions, including outside
- How to change the title and labels in a Seaborn legend
- How to change the font size of legend titles and labels
- How to customize additional properties, including adding a shadow to the legend
Table of Contents
How Can You Customize Legends in Seaborn
In order to customize legends in Seaborn, you can use the .legend() function available in Matplotlib pyplot. In general, you call the function as shown below:
import seaborn as sns
import matplotlib.pyplot as plt

...

plt.legend()
When you call the function, you can pass in various parameters that allow you to customize the legend. Let’s dive into how to move the legend location first.
How to Move a Legend Location in Seaborn
In order to move a legend location in Seaborn, use the loc= argument in the plt.legend() function. The argument accepts both a named location as well as a numbered location. The table below breaks down the different locations, both named and numbered, that are available:
| Location String | Location Code |
|---|---|
'best' | 0 |
'upper right' | 1 |
'upper left' | 2 |
‘lower left' | 3 |
'lower right' | 4 |
'right' | 5 |
'center left' | 6 |
'center right' | 7 |
'lower center' | 8 |
'upper center' | 9 |
'center' | 10 |
Let’s start by looking at named locations first, since they’re quite a bit more intuitive. By default, Seaborn will use a location of 'best' or 0. It will determine where the best location for the legend is, depending on where the data points are in the chart.
# Moving a Legend in Seaborn Using Named Locations
import seaborn as sns
import matplotlib.pyplot as plt
df = sns.load_dataset('tips')
sns.scatterplot(data=df, x='total_bill', y='tip', hue='day')
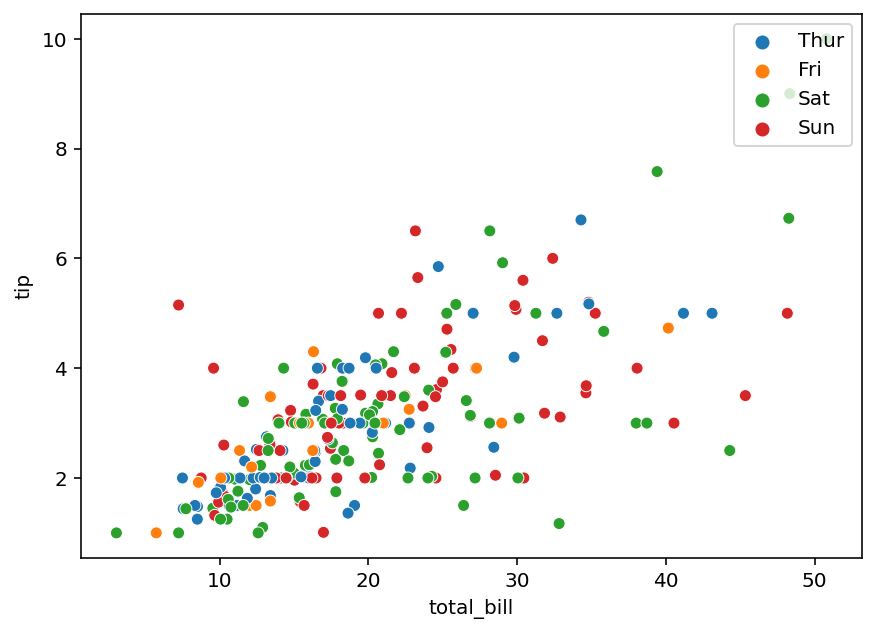
plt.legend(loc='upper center')
plt.show()In the example below, we loaded the 'tips' dataset available in the Seaborn library and made a Seaborn scatterplot with the data. We then used the plt.legend() function and passed in the 'upper center' into the loc= parameter. This returned the following visualization:

We can see that the location of the legend has changed to the upper middle position. Similar to using named positions, we can also use numbered positions. Let’s see how this works.
# Moving a Legend in Seaborn Using Numbered Positions
import seaborn as sns
import matplotlib.pyplot as plt
df = sns.load_dataset('tips')

sns.scatterplot(data=df, x='total_bill', y='tip', hue='day')
plt.legend(loc=1)
plt.show()
In the code block above, we passed in the location of 1. This returns the following visualization:
We can see that by passing in location of 1, that the location of the legend has changed to the top right. We can also see that the legend now covers a data point. Because of this, we need to be mindful of where we place the legend.
How to Move a Legend Outside in Seaborn
To move a legend outside of a plot in Seaborn, you can combine the loc= parameter and the bbox_to_anchor= parameter. The bbox_to_anchor parameter allows you to specify where the legend should be placed, relative to the plot itself.
Let’s take a look at an example of how this works:
# Moving a Legend in Seaborn Outside the Plot
import seaborn as sns
import matplotlib.pyplot as plt
df = sns.load_dataset('tips')
sns.scatterplot(data=df, x='total_bill', y='tip', hue='day')
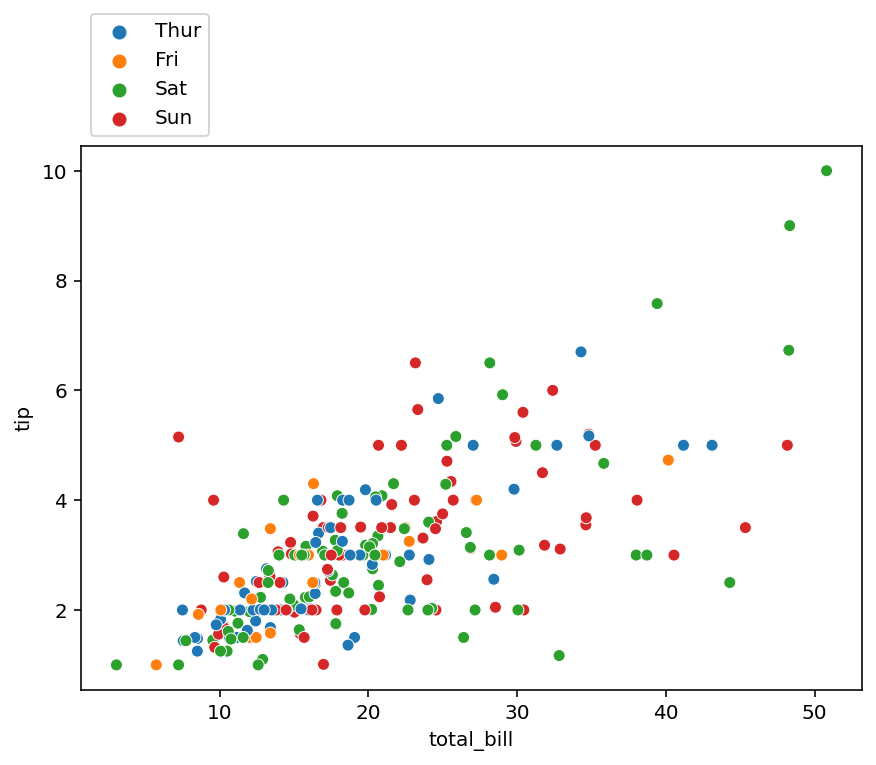
plt.legend(loc='upper left', bbox_to_anchor=(1, 1))
plt.show()We can see that the legend is now placed outside of the plot area, as shown below:

But how does this work? When you use both the loc= and the bbox_to_anchor= parameter, the loc= parameter specifies where the legend should be bound. In this case, by specifying top left, the legend is anchored by its top left point. Then, by passing in a tuple of (1, 1), the location is changed so that the bounding box (the top left of the legend) is at the top right of the plot itself.
To place a legend at the top left outside of a plot in Seaborn, you can use the following code:
# Moving a Legend in Seaborn Outside the Plot
import seaborn as sns
import matplotlib.pyplot as plt
df = sns.load_dataset('tips')

sns.scatterplot(data=df, x='total_bill', y='tip', hue='day')
plt.legend(loc='lower left', bbox_to_anchor=(0, 1))
plt.show()
This returns the image below:
We can see that for the bounding location, we’re using the 'lower left'. This means that any location of the legend we pass into the bbox_to_anchor= parameter will use the lower left as its bound. By passing in the tuple of (0, 1), we tell Seaborn that we want the position to be bound to the far left (x = 0) of the graph, and at the top of the graph (y = 1).
In the following section, you’ll learn how to remove a legend in Seaborn entirely.
How to Remove a Legend in Seaborn
In order to remove a legend in Seaborn, we can pass the legend=False argument into the plotting function itself. In this case, we don’t need to use the plt.legend() function. The parameter is available in the different plotting functions in Seaborn. Let’s see what this looks like:
#How to Remove a Legend in Seaborn
import seaborn as sns
import matplotlib.pyplot as plt
df = sns.load_dataset('tips')

sns.scatterplot(data=df, x='total_bill', y='tip', hue='day', legend=False)
plt.show()
By running this code, we remove the legend from our Seaborn graph as shown in the image below:

In the following section, you’ll learn how to change legend labels in Seaborn.
How to Change Legend Labels in Seaborn
In order to change the legend labels in a Seaborn graph, use the labels= parameter in the plt.legend() function. This allows you to pass in a list of values that represent the different labels you want to apply to the legend.
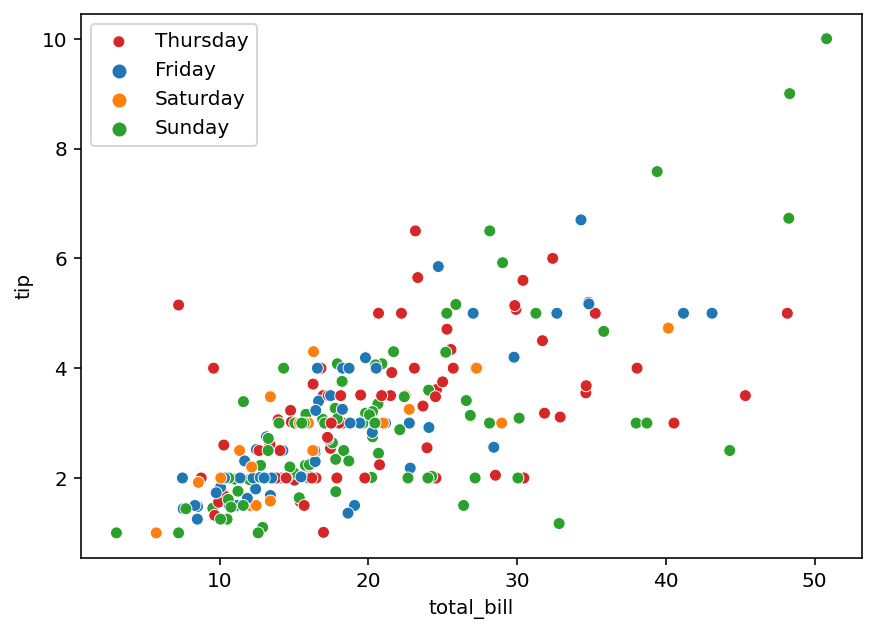
In our example graph, the legend shows the days as abbreviated. We may want to expand these to the full name. In order to do this, we can pass in labels=['Thursday', 'Friday', 'Saturday', 'Sunday'] into the plt.legend() function.
# How to Change Legend Labels in Seaborn
import seaborn as sns
import matplotlib.pyplot as plt
df = sns.load_dataset('tips')

sns.scatterplot(data=df, x='total_bill', y='tip', hue='day')
plt.legend(labels = ['Thursday', 'Friday', 'Saturday', 'Sunday'])
plt.show()
This returns the following visualization with our custom labels:
In the following section, you’ll learn how to add a title to a legend in Seaborn.
How to Add a Title to a Legend in Seaborn
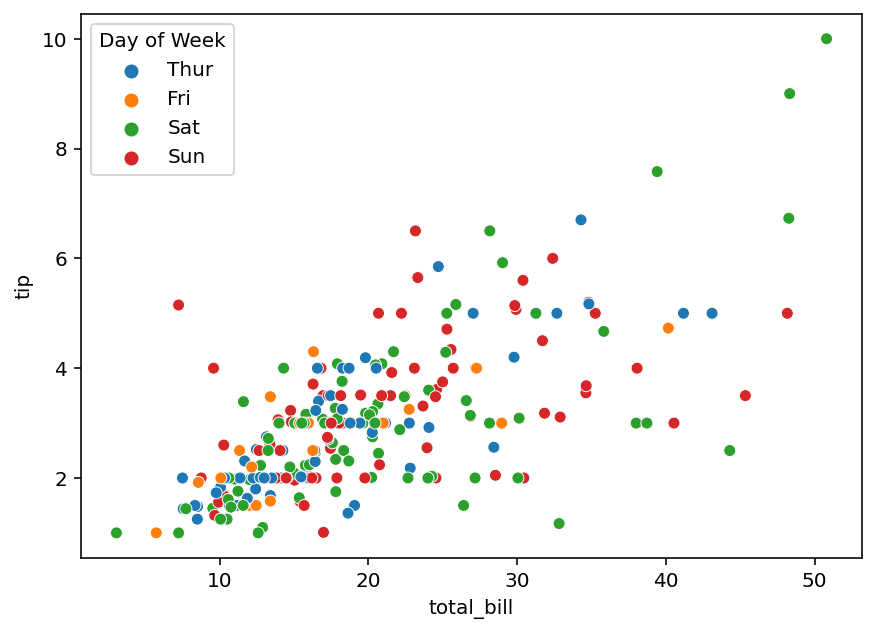
Adding a title to a legend can be a helpful way in which to better describe the data that’s in your graph. For example, while our current legend shows the day of the week, that can be made clearer by adding a title.
In order to add a title to a Seaborn plot legend, you can use the title= parameter in the plt.legend() function. The parameter accepts a string that allows you to customize the title. Let’s see what this looks like:
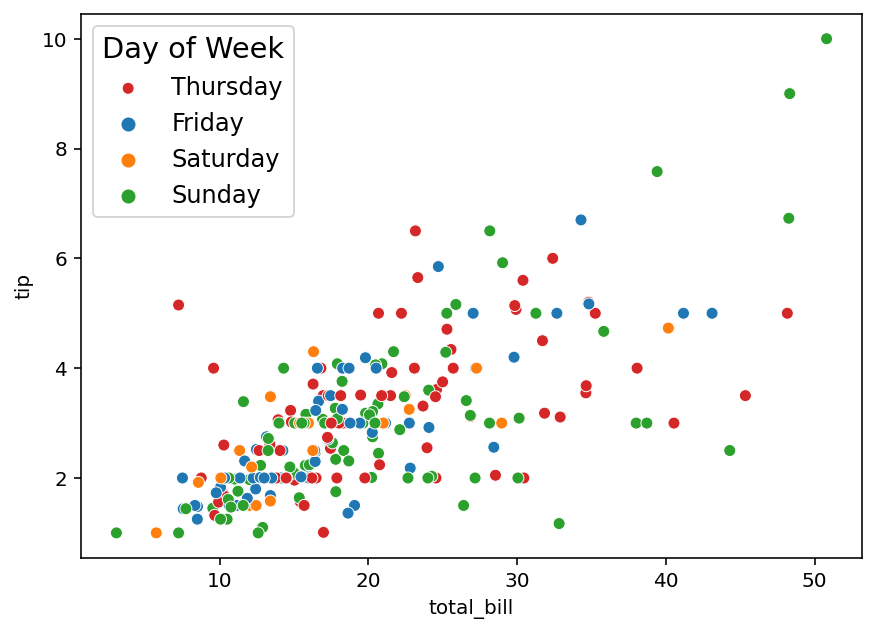
# How to Add a Legend Title in Seaborn
import seaborn as sns
import matplotlib.pyplot as plt
df = sns.load_dataset('tips')

sns.scatterplot(data=df, x='total_bill', y='tip', hue='day')
plt.legend(title='Day of Week')
plt.show()
In the code block above, we specified the title of 'Day of Week' for our legend. Let’s see what this looks like in Seaborn:
We can also customize the font sizes in a Seaborn legend – this is what you’ll learn in the following section.
How to Change Font Size in a Legend in Seaborn
In this section, you’ll learn how to change the font size in a legend in Seaborn. This can be done in two different ways:
fontsize=controls the size of the text in the legend,title_fontsize=control the size of the title in the legend
Seaborn lets you use either named sizes, such as we do in the example below, or actual sizes as numbers in pixel font size.
Let’s see how we can customize both the size of the font in the legend and the legend title in Seaborn:
# How to Change Legend Text Font Size
import seaborn as sns
import matplotlib.pyplot as plt
df = sns.load_dataset('tips')

sns.scatterplot(data=df, x='total_bill', y='tip', hue='day')
plt.legend(
    labels = ['Thursday', 'Friday', 'Saturday', 'Sunday'],
    fontsize='large',
    title='Day of Week',
    title_fontsize='x-large')
plt.show()
By using this code, we return the following visualization.
We can see that both the size of the legend title and the legend itself has been modified.
How to Remove the Border from a Legend in Seaborn
In order to remove a border from a legend in Seaborn, you can pass in the frameon=False argument. This instructs Seaborn to remove the border from a legend in the plot. This can be quite helpful when you want to have a cleaner appearance of your plot.
Let’s see what the code for this looks like:
# How to Remove a Frame From a Legend in Seaborn
import seaborn as sns
import matplotlib.pyplot as plt
df = sns.load_dataset('tips')

sns.scatterplot(data=df, x='total_bill', y='tip', hue='day')
plt.legend(frameon=False)
plt.show()
When we run this code, we get back the following visualization:

We can see that the border of the legend has been removed. In the following section, you’ll learn how to change and add columns in a legend in Seaborn.
How to Change Columns in a Legend in Seaborn
Adding columns in a legend in Seaborn can be done by using the ncols= parameter in the plt.legend() function. Splitting the legend into columns can be a great way to display the legend in a horizontal format.
Let’s see what this looks like in Python:
# How to Add Columns to a Legend in Seaborn
import seaborn as sns
import matplotlib.pyplot as plt
df = sns.load_dataset('tips')

sns.scatterplot(data=df, x='total_bill', y='tip', hue='day')
plt.legend(ncol=2)
plt.show()
In the code above, we split the legend into two columns. This allows you to have two items in each column. If we had passed in 4, then the items would be displayed as a row.

We can see that by using two columns, that the legend items are split into columns.
How to Change the Marker Position in a Legend in Seaborn
In some cases, you may want to place the marker to the right of the legend label. By default, the markers are on the left. In order to do this, you can use the markerfirst= parameter in the plt.legend() function. By default, this is set to True.
Let’s see how we can use Seaborn to have the markers to the right of the label:
# How to Move Markers First in Legend in Seaborn
import seaborn as sns
import matplotlib.pyplot as plt
df = sns.load_dataset('tips')

sns.scatterplot(data=df, x='total_bill', y='tip', hue='day')
plt.legend(markerfirst=False)
plt.show()
This returns the visual below, where the markers are on the right of the label:

In the section below, you’ll learn how to add a shadow to a legend in Seaborn.
How to Add a Shadow to a Legend in Seaborn
Adding a shadow to a legend can be a helpful way to add dimension to the legend itself. In order to do this in Seaborn, you can use the shadow= parameter of the plt.legend() function. The parameter accepts a boolean value and defaults to False.
Let’s see how we can add a shadow to our legend by passing in shadow=True into our plot:
# How to Add a Shadow to a Legend in Seaborn
import seaborn as sns
import matplotlib.pyplot as plt
df = sns.load_dataset('tips')

sns.scatterplot(data=df, x='total_bill', y='tip', hue='day')
plt.legend(shadow=True)
plt.show()
This returns the following visualization where a shadow has been added to the legend:

We can see that by adding shadow=True to our function, that a shadow was added to our legend.
Frequently Asked Questions
You can change the location of a legend in Seaborn by using the loc= parameter of the plt.legend() function. Because Seaborn uses Matplotlib under the hood, you can modify Seaborn legends using the plt.legend() function.
To move a legend outside of a Seaborn plot, you can use the loc and bbox_to_anchor parameters of the plt.legend() function. For example, to move a legend to the outside of the top right of a plot, you can use the following code: plt.legend(loc=’lower left’, bbox_to_anchor=(0, 1))
To add a legend to a Seaborn plot, you can pass the title parameter into the plt.legend() function. Since Seaborn uses Matplotlib under the hood, you can pass a string into the parameter and Seaborn will add a title to the legend.
Conclusion
In this tutorial, you learned how to add and customize legends in Seaborn data visualizations. Being able to add and customize legends is an important skill that can make understanding your visualizations much easier. Because Seaborn uses Matplotlib under the hood, you can customize your visualizations to a large extent.
Throughout this tutorial, you walked through many different cases in which you can customize your Seaborn legends, such as by changing the position, labels, and size.
Additional Resources
To learn more about related topics, check out the resources below: