
In this tutorial, you’ll learn how to define and set the marker size in Matplotlib scatterplots. Being able to control the size of your Matplotlib scatterplots allows you to add extra information to your scatterplots.
This allows you to communicate more details about your data and make it clearer to your visualization’s readers. Matplotlib allows you to customize the size for all plots as well as for individual plots, based on other data criteria.
By the end of this tutorial, you’ll have learned:
- How to set the marker size for all points in a Matplotlib scatterplot
- How to set the marker size for points in a Matplotlib scatterplot based on other data
- Develop a function to define marker size in Matplotlib
Table of Contents
Loading a Sample Matplotlib Scatterplot
In order to follow along with this tutorial, feel free to load the plot below. The code loads both x and y coordinates for a scatterplot. Additionally, we set the x and y limits of the plot and give the plot a title to better understand what is going on.
# Loading a sample scatter plot
import matplotlib.pyplot as plt
plt.style.use('seaborn')
x = [1,2,3,4,5,6,7,8,9]
y = [2,4,6,7,4,3,2,4,6]

plt.scatter(x, y)
plt.xlim(0, 10)
plt.ylim(0, 10)
plt.title('A Sample Scatter Plot - datagy.io')
plt.show()
This returns the following image:

In the next section, you’ll learn how to change the marker size for all points in a Matplotlib scatterplot.
Changing the Marker Size for All Points in Matplotlib Scatterplots
Matplotlib makes it simple to change the plot size for all points in a scatter plot. The size of points is based on the s= parameter. The parameter accepts either an integer or a list of values. These options determine what the size of the markers is:
- Passing in a single value changes the size for all markers
- Passing in a list of values changes the size for each marker individually
Let’s see how we can change the size for all markers using the s= parameter:
# Changing the size for all markers in Matplotlib
import matplotlib.pyplot as plt
plt.style.use('seaborn')
x = [1,2,3,4,5,6,7,8,9]
y = [2,4,6,7,4,3,2,4,6]

# Using s= to change the marker size
plt.scatter(x, y, s=100)
plt.xlim(0, 10)
plt.ylim(0, 10)
plt.title('Changing Marker Sizes for All Points - datagy.io')
plt.show()
This returns the following image:
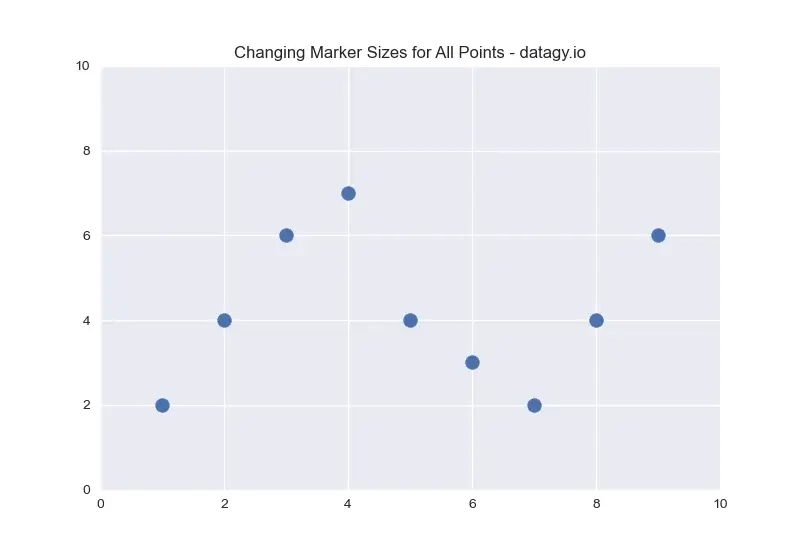
To understand what the s= parameter controls, we need to take a look at the documentation. The s parameter is defined as the marker size in points ** 2, meaning that the value passed in is squared. In order to get a marker that is, say, size 10, we need to pass in the square of that.
Changing the Marker Size for Individual Points in Matplotlib Scatterplots Based on Other Data
In this section, we’ll look at using another set of values to set the size of matplotlib scatterplot markers. Let’s say we had another dimension to our data, we can use the values in that dimension to control the size. Because the s= parameter also accepts an array of values, we can simply pass in that array.
Let’s see what this might look like. We’ll add another array of values that will control the size:
# Controlling the size of markers with another variable
import matplotlib.pyplot as plt
plt.style.use('seaborn')
x = [1,2,3,4,5,6,7,8,9]
y = [2,4,6,7,4,3,2,4,6]

# Adding another variable to control size
z = [10,20,10,15,100,25,50,70,80]

plt.scatter(x, y, s=z)
plt.xlim(0, 10)
plt.ylim(0, 10)
plt.title('Changing Marker Sizes Based on Another Value - datagy.io')
plt.show()
This returns the following image:
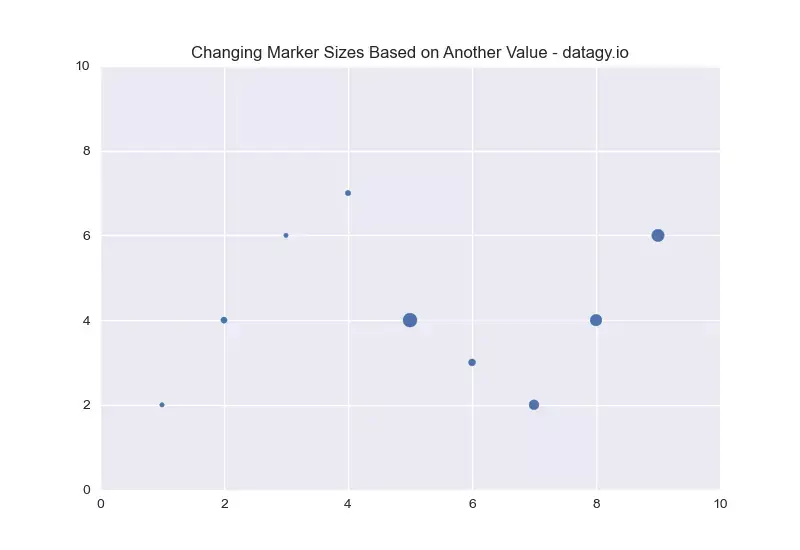
This can be a very helpful method when we’re attempting to control the size of a marker based on a DataFrame column.
Define a Function to Define Marker Sizes in Matplotlib
Following the logic of the example above, we can define a function that uses either the x or y parameters to define the size of markers in a Matplotlib scatterplot. The example below is just that – an example. You can define the function however you like.
In the code below, the size of the marker is relative to the value of x, increasing it by a factor of 3:
# Using a function to define marker size
import matplotlib.pyplot as plt
plt.style.use('seaborn')
x = [1,2,3,4,5,6,7,8,9]
y = [2,4,6,7,4,3,2,4,6]

def set_marker_size(x, factor):
    return [x_i**factor for x_i in x]

plt.scatter(x, y, s=set_marker_size(x,3))
plt.xlim(0, 10)
plt.ylim(0, 10)
plt.title('Changing Marker Sizes Using a Function - datagy.io')
plt.show()
This returns the following image:

What is the Marker Size in Matplotlib?
Understanding what the marker size represents simplifies a lot of the understanding behind it. It may feel like we’ve been setting values arbitrarily. However, as with everything else in Matplotlib there is significant logic behind it.
Each point is actually the pixel size, which varies by the resolution that you set for the figure itself. By default, Matplotlib uses a resulting of 100 DPI (meaning, per inch). If you were to change this, then the relative sizes that you see would change as well.
Conclusion
In this tutorial, you learned how to set the marker size of scatterplot points in Matplotlib. Being able to modify the size of markers allows you to more effectively communicate the intent of your data. You first learned how to change the size of all markers. Then, you learned how to change the size of markers based on another value. This allows you to add another dimension to your data.
Additional Resources
To learn more about related topics, check out the tutorials below: