
In this tutorial, you’ll learn how to change font sizes on a Matplotlib plot. You’ll learn everything you need to know to customize your Matplotlib plot to have exactly the font sizes you want. Data visualization is an incredible tool to better communicate your data. Being able to style your plot in the way you want is an important part of that.
By the end of this tutorial, you’ll have learned:
- How to change font sizes globally in Matplotlib
- How to change font sizes of titles, axis labels, and tick labels
- Change font sizes using rc parameters
- Resetting font sizes back to default values in Matplotlib
Table of Contents
Loading a Sample Plot
In order to follow along with this tutorial, I have provided some code below to load a sample plot. Feel free to use your own plot, though your code will vary a little bit, of course. The plot below will include a lot of boilerplate code to include multiple text elements that we can manipulate more easily:
# Loading a Sample Matplotlib Plot
import matplotlib.pyplot as plt

fig, ax = plt.subplots(figsize=(12, 8))

x = range(1,11)
y = [i**2 for i in x]
z = [i**3 for i in x]

ax.plot(x, y, color='green', label='y= x^2')
ax.plot(x, z, color='blue', label='y = x^3')
ax.set_title('Some Fun Lines')
ax.set_xlabel('Time')
ax.set_ylabel('Values')
leg = ax.legend()

plt.show()
This returns the following image:
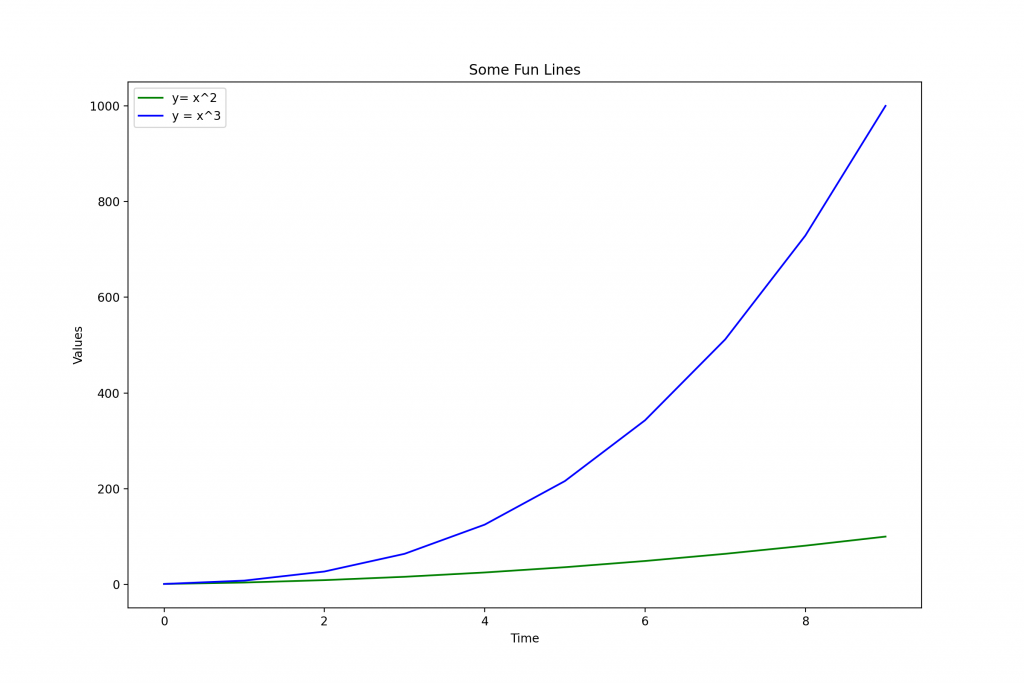
In the graph above, we have the following text elements to modify the font size on:
- Title
- y-axis and y-axis
- Tick labels
- Legend
Changing Font Sizes in Matplotlib Using Fontsize
Every Matplotlib function that deals with fonts, such as the ones we used above, has a parameter named fontsize= to control the font size. This means when we set, say, a title using the .set_title() function, we can pass in an argument to specify the font size.
Let’s see how we can make use of this using the boilerplate code we used above:
# Changing the Font Size in Matplotlib Using fontsize=
import matplotlib.pyplot as plt

fig, ax = plt.subplots(figsize=(12, 8))

x = range(1,11)
y = [i**2 for i in x]
z = [i**3 for i in x]

ax.plot(x, y, color='green', label='y= x^2')
ax.plot(x, z, color='blue', label='y = x^3')
ax.set_title('Some Fun Lines', fontsize=18)
ax.set_xlabel('Time', fontsize=14)
ax.set_ylabel('Values', fontsize=14)
leg = ax.legend(fontsize=12)

plt.show()
This returns the following image:
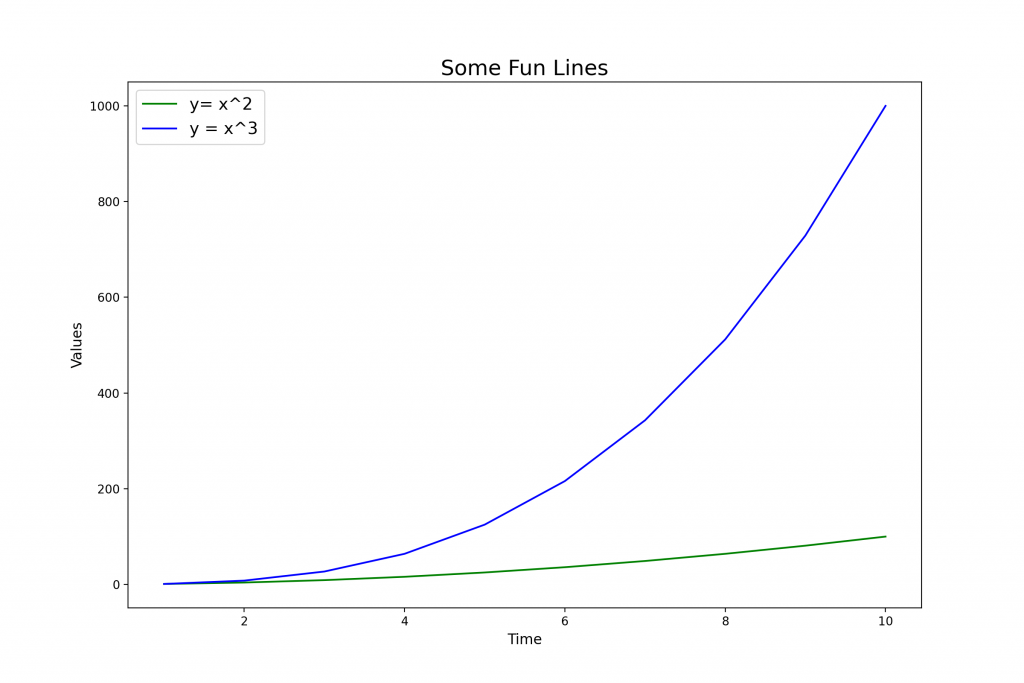
If you’re creating multiple plots, this method can be a little bit time-consuming. In these cases, it can be helpful to use rcParams to modify the font sizes for all plots in the current program. This is what you’ll learn in the following section.
Using rc Parameters to Change Font Sizes in Matplotlib
Using rcParams is a helpful way to modify attributes of the Matplotlib library for a given Python program. This can be helpful when you’re generating multiple plots and want them all to be styled the same.
Matplotlib comes with a huge number of rcParams, which you can access using the plt.rcParams.keys() function. This function returns all the keys that you can modify.
In the code below, we modify a number of different font sizes belonging to different parts of our data visualization:
# Changing the Font Size Using rcParams
import matplotlib.pyplot as plt

fig, ax = plt.subplots(figsize=(12, 8))

x = range(1,11)
y = [i**2 for i in x]
z = [i**3 for i in x]

plt.rc('axes', titlesize=10)        # Controls Axes Title
plt.rc('axes', labelsize=10)        # Controls Axes Labels
plt.rc('xtick', labelsize=10)       # Controls x Tick Labels
plt.rc('ytick', labelsize=10)       # Controls y Tick Labels
plt.rc('legend', fontsize=16)       # Controls Legend Font
plt.rc('figure', titlesize=10)      # Controls Figure Title

ax.plot(x, y, color='green', label='y= x^2')
ax.plot(x, z, color='blue', label='y = x^3')
ax.set_title('Some Fun Lines')
ax.set_xlabel('Time')
ax.set_ylabel('Values')
leg = ax.legend()

plt.show()
This returns the following image:

Resetting Font Sizes to Default in Matplotlib
Once you’ve modified your rcParams, you may wish to reset them to the default Matplotlib settings. This can be helpful if you’ve overwritten a useful parameter or simply want to return back to the default settings.
Matplotlib provides a helpful function to make this easy. If you need to reset your Matplotlib rcParams back to their default values, simply run the code below:
# Resetting rcParams in Matplotlib
plt.rcParams.update(plt.rcParamsDefault)
Conclusion
In this tutorial, you learned how to use Matplotlib to change the font sizes in your visualization. This can be helpful in order to create more attractive visualizations for your plots. You first learned how to change a font size using the fontsize= parameter, which is available in all Matplotlib functions that generate text output. Then, you learned how to change font sizes globally for multiple plots using rcParams. Finally, you learned howto reset rcParams to their default values.
Additional Resources
To learn more about related topics, check out the tutorials below: