In this tutorial, you’ll learn how to use the NumPy exponential function, np.exp(). The function raises the Euler’s constant, e, to a given power. Because Euler’s constant has many practical applications in science, math, and deep learning, being able to work with this function in meaningful ways is an asset for any Python user!
By the end of this tutorial, you’ll have learned:
- What the np.exp() function does
- How to apply the function to a single value and to NumPy arrays
- How to use the function to graph exponential arrays
Table of Contents
Understanding the np.exp() Function
The NumPy exp() function is used to calculate the exponential of all the elements in an array. This means that it raises the value of Euler’s constant, e, to the power all elements of an array, or a single element, passed into the function. Euler’s constant is roughly equal to 2.718 and has many practical applications such as calculating compound interest. To learn more about Euler’s constant in Python, check out my in-depth tutorial here.
The exponential function is commonly used in deep learning in the development of the sigmoid function. Let’s take a look at the function:
# Understanding the np.exp() Function
import numpy as np

np.exp(
    x=,         # Input values
    out=None,   # Location to store
    where=True  # Condition to broadcast over input
)
In most cases, you’ll see the function applied only with the x argument supplied. Let’s take a look at how we can run the function with a single value passed in:
# Running the np.exp() Function with a Single Value
import numpy as np
print(np.exp(1))

# Returns: 2.718281828459045
The function call above is the same as calling e1. The real value of the function comes into play when its applied to entire arrays of numbers. This is what you’ll learn in the next section.
How to Apply the np.exp() Function to a 2-Dimensional Array
In this section, you’ll learn how to apply the np.exp() function an array of numbers. Applying the function to an array works the same as applying it to a scalar, only that we pass in an array. Because numpy works array-wise, the function is applied to each element in that array.
Let’s take a look at an example:
# Applying the np.exp() Function to a 2-d Array
import numpy as np

arr = np.arange(1,6)
print(np.exp(arr))

# Returns: [  2.71828183   7.3890561   20.08553692  54.59815003 148.4131591 ]
In the example above, we use the np.arange() function to create the values from 1 through 5. We then pass this array into the np.exp() function to process each item.
The function also works for multi-dimensional arrays, as shown in the next section.
How to Apply the np.exp() Function to a Multi-Dimensional Array
Similar to working with two-dimensional arrays, the np.exp() can be applied to multi-dimensional arrays. The function will be broader to each value in the array, despite its dimensionality. Let’s take a look at an example:
# Applying the np.exp() Function to a Multidimensional Array
import numpy as np

arr = np.arange(4).reshape((2, 2))
print(np.exp(arr))

# Returns:
# [[ 1.          2.71828183]
#  [ 7.3890561  20.08553692]]
In the example above, we reshape the values of 0 through 3 into a 2×2 array. We then pass this array into the np.exp() function.
How to Graph the np.exp() Function Using Matplotlib
In this final section, we’ll learn how to plot the resulting arrays of the np.exp() function to see how it behaves. We can create a finely spaced array using the np.linspace() function to create a linear space, which we can pass into the function.
Let’s take a look at how we can do this:
# Graphing the np.exp() Function
import numpy as np
import matplotlib.pyplot as plt

x = np.linspace(0, 10, 1000)
y = np.exp(x)

plt.plot(x, y)
plt.show()
In the example above, we create an evenly-spaced array of numbers from 0 through 10 with 1000 values. We then pass this array into the np.exp() function. This returns the following plot:
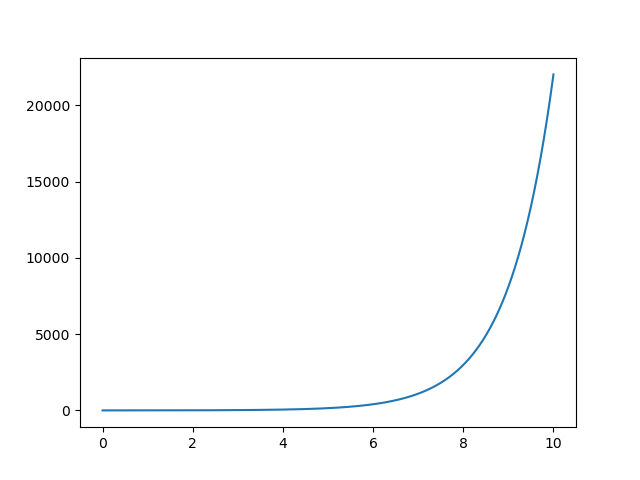
This shows the distribution of the exponential function.
Conclusion
In this post, you learned how to use the np.exp() function. You learned how the function is commonly applied in machine learning and deep learning. Then, you learned how to use the function on a scalar, a 2-dimensional array, and a multi-dimensional array. Finally, you learned how to plot the function using Matplotlib.
Additional Resources
To learn more about related topics, check out the tutorials below: