In this post, you’ll learn how to create Matplotlib line charts, including adding multiple lines, adding titles and axis labels, customizing plot points, adding legends, and customizing with Matplotlib styles.
Table of Contents
Loading our data
Let’s begin by loading in our libraries and some sample data. We’ll use a bit of time series data that covers off temperature over the course of a year in Toronto, Canada.
import pandas as pd
import matplotlib.pyplot as plt

df = pd.read_excel('https://github.com/datagy/mediumdata/raw/master/toronto-weather.xlsx', parse_dates=['LOCAL_DATE'])

print(df.head())
Printing out the first five rows returns the following:
          STATION_NAME LOCAL_DATE  MEAN_TEMPERATURE  MIN_TEMPERATURE  MAX_TEMPERATURE
0  TORONTO CITY CENTRE 2020-01-01               0.5             -0.8              1.7
1  TORONTO CITY CENTRE 2020-01-02               3.3              1.6              4.9
2  TORONTO CITY CENTRE 2020-01-03               5.1              3.0              7.2
3  TORONTO CITY CENTRE 2020-01-04               2.1              0.3              3.9
4  TORONTO CITY CENTRE 2020-01-05               0.4             -0.9              1.7
If you’re working in Jupyter notebooks and want to display these charts inline, add the following Jupyter magic to your import statement:
%matplotlib inlineHow to create Matplotlib line charts?
Matplotlib makes it incredibly easy to add a simple line chart using pyplot’s .plot() method. Let’s see how we can do this using the MEAN_TEMPERATURE data:
plt.plot(df['LOCAL_DATE'], df['MEAN_TEMPERATURE'])
plt.show()
What we’ve done is assign the LOCAL_DATE variable to the x-axis and the MEAN_TEMPERATURE variable to the y-values.
You can see below, that Matplotlib has automatically aggregated the x-axis labels to months:

How to add titles and axis labels to Matplotlib line charts?
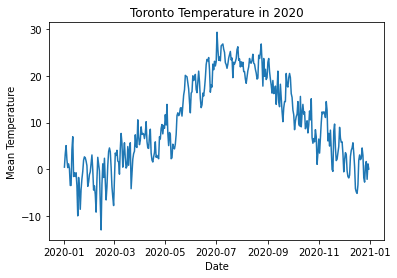
Right now our chart shows our data, but it may not be the most informative. Let’s add a title as well as some axis labels.
We can even go further and add font sizes to these labels:
plt.plot(df['LOCAL_DATE'], df['MEAN_TEMPERATURE'])
plt.title('Toronto Temperature in 2020')
plt.xlabel('Date')
plt.ylabel('Mean Temperature')
plt.show()
This returns the following plot:
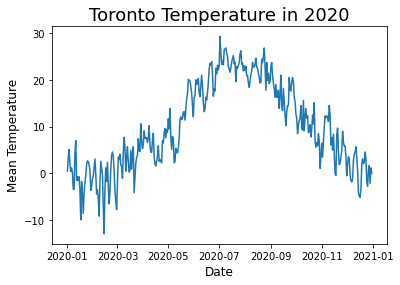
To change the font sizes, lets add the fontsize= parameter to each title and label attribute:
plt.plot(df['LOCAL_DATE'], df['MEAN_TEMPERATURE'])
plt.title('Toronto Temperature in 2020', fontsize=18)
plt.xlabel('Date', fontsize=12)
plt.ylabel('Mean Temperature', fontsize=12)
plt.show()
This returns the following chart:
Check out some other Python tutorials on datagy, including our complete guide to styling Pandas and our comprehensive overview of Pivot Tables in Pandas!
How to customize lines with colours and data points?
Matplotlib makes it easy customize lines with colours as well as data points. Let’s see how we can change the colour of the line to grey and add some data point labels to each point:
plt.plot(df['LOCAL_DATE'], df['MEAN_TEMPERATURE'], color='grey', marker='o')
plt.title('Toronto Temperature in 2020', fontsize=18)
plt.xlabel('Date', fontsize=12)
plt.ylabel('Mean Temperature', fontsize=12)
plt.show()
This prints out the following:
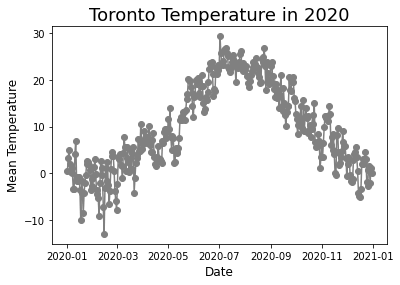
You can find other available marker styles on the main documentation here.
How to add gridlines to line charts?
Our chart can still be a little hard to read. Let’s go ahead and add some gridlines to the chart to help identify positions more easily. This can be done by passing in plt.grid(True). Let’s see how this is done:
plt.plot(df['LOCAL_DATE'], df['MEAN_TEMPERATURE'], color='grey', marker='o')
plt.title('Toronto Temperature in 2020', fontsize=18)
plt.xlabel('Date', fontsize=12)
plt.ylabel('Mean Temperature', fontsize=12)
plt.grid(True)
plt.show()
This returns the following chart:

How to add multiple lines to Matplotlib line charts?
Let’s see how to add multiple lines to these charts. This can be done by simply appending a new plot to the code.
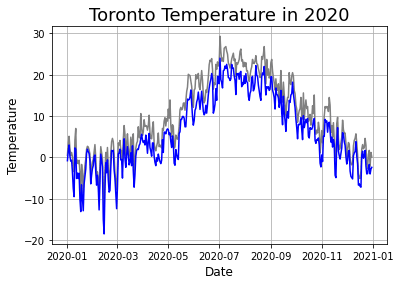
Let’s give this a shot using the minimum temperature and changing the colour to blue:
plt.plot(df['LOCAL_DATE'], df['MEAN_TEMPERATURE'], color='grey')
plt.plot(df['LOCAL_DATE'], df['MIN_TEMPERATURE'], color='blue')
plt.title('Toronto Temperature in 2020', fontsize=18)
plt.xlabel('Date', fontsize=12)
plt.ylabel('Temperature', fontsize=12)
plt.grid(True)
plt.show()
This returns the following chart:
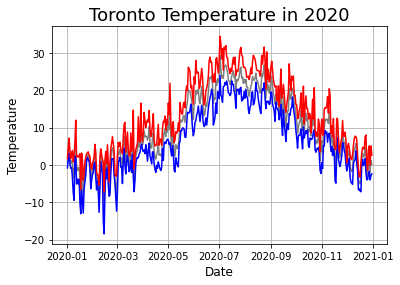
Let’s go one step further and add the max temperature to the plot as well, coloured in red:
plt.plot(df['LOCAL_DATE'], df['MEAN_TEMPERATURE'], color='grey')
plt.plot(df['LOCAL_DATE'], df['MIN_TEMPERATURE'], color='blue')
plt.plot(df['LOCAL_DATE'], df['MAX_TEMPERATURE'], color='red')
plt.title('Toronto Temperature in 2020', fontsize=18)
plt.xlabel('Date', fontsize=12)
plt.ylabel('Temperature', fontsize=12)
plt.grid(True)
plt.show()
This returns the following plot:
How to add a legend to Matplotlib line charts?
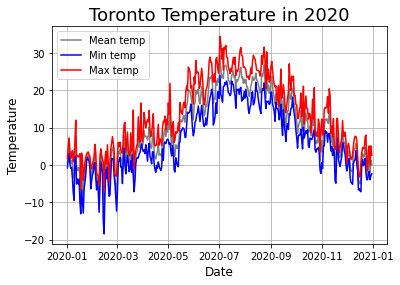
Now that we have multiple lines in the chart, it may be helpful to add a legend to the chart to be able to better tell them apart.
In Matplotlib, we can do this by passing in labels into each of the data elements and setting the .legend() parameter:
plt.plot(df['LOCAL_DATE'], df['MEAN_TEMPERATURE'], color='grey', label='Mean temp')
plt.plot(df['LOCAL_DATE'], df['MIN_TEMPERATURE'], color='blue', label='Min temp')
plt.plot(df['LOCAL_DATE'], df['MAX_TEMPERATURE'], color='red', label='Max temp')
plt.title('Toronto Temperature in 2020', fontsize=18)
plt.xlabel('Date', fontsize=12)
plt.ylabel('Temperature', fontsize=12)
plt.legend()
plt.grid(True)
plt.show()
This returns the following plot:
How to add a style to Matplotlib charts?
Finally, let’s learn how to style the plot to make it… a little nicer to look at. Matplotlib comes with a number of built-in styles, which you can discover here.
Let’s set it to the ggplot style:
plt.style.use('ggplot')
plt.plot(df['LOCAL_DATE'], df['MEAN_TEMPERATURE'], color='grey', label='Mean temp')
plt.plot(df['LOCAL_DATE'], df['MIN_TEMPERATURE'], color='blue', label='Min temp')
plt.plot(df['LOCAL_DATE'], df['MAX_TEMPERATURE'], color='red', label='Max temp')
plt.title('Toronto Temperature in 2020', fontsize=18)
plt.xlabel('Date', fontsize=12)
plt.ylabel('Temperature', fontsize=12)
plt.legend()
plt.grid(True)
plt.show()
This returns the following chart:

Conclusion
In this post, you learned create Matplotlib line charts, including adding multiple lines, adding titles and axis labels, customizing plot points, adding legends, and customizing with Matplotlib styles.
To learn how to make other chart types, such as histograms check out my collection here.