
In this tutorial, you’ll learn how to add titles to your Matplotlib plots. You’ll learn how to add a title, a subtitle, and axis labels to your plot and subplots. You’ll learn how to style these titles individually and to multiple plots at once.
Being able to add titles gives you the ability to better communicate what your data is saying. Matplotlib gives you incredible flexibility to better customize and tweak every element of your plots titles.
By the end of this tutorial, you’ll have learned:
- How to add titles, subtitles, and axis titles to your plot
- How to style and position titles in Matplotlib
- How to style titles individually and globally in Matplotlib
- How to reset styles back to default styles in Matplotlib
Table of Contents
Creating a Sample Plot
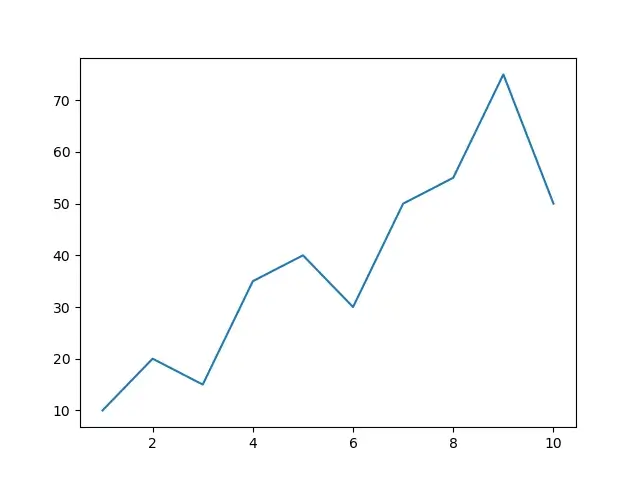
To start off, let’s create a sample plot that we can use throughout the tutorial. If you’re not working with your own plot, you can copy and paste the code below in order to follow along.
We’ll import matplotlib.pyplot using the convention plt and load some sample data to visualize our data.
# Loading a Sample Plot in Matplotlib
import matplotlib.pyplot as plt

x = range(1, 11)
y = [10, 20, 15, 35, 40, 30, 50, 55, 75, 50]

plt.plot(x, y)
plt.show()
This returns the following plot:
Adding a Title to a Matplotlib Plot
Adding a title to a Matplotlib plot is done using the .title() method. The method lets you pass in a string that represents the title that you want to apply. Let’s see how we can use this method to add a title, "Your Chart's Title" to your plot:
# Adding a Simple Title to Our Matplotlib Chart
import matplotlib.pyplot as plt

x = range(1, 11)
y = [10, 20, 15, 35, 40, 30, 50, 55, 75, 50]

plt.plot(x, y)

# Adding a Title to Our Plot
plt.title("Your Chart's Title")
plt.show()
This returns the following image:

We can see that the title is applied with Matplotlib’s default values. These values are quite plain. We can easily control the font styling, sizing, and positioning using Matplotlib. This is what you’ll learn in the next section.
Changing Font Sizes and Positioning in Matplotlib Titles
Matplotlib provides you with incredible flexibility to style your plot’s title in terms of size, style, and positioning (and many more). Let’s take a look at the parameters we can pass into the .title() method in order to style our text:
fontsize=controls the size of the font and accepts an integer or a stringloc=controls the positioning of the textfontweight=controls the the weight of the fontstyle=controls the style of the fontfamily=controls the font family of the font
There are many, many more attributes that you can learn about in the official documentation. The ones above represent the key parameters that we can use to control the styling.
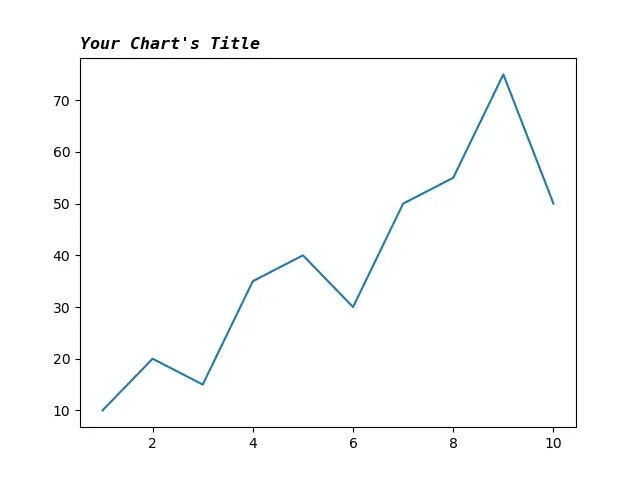
Let’s see how we can use these parameters to style our plot:
# Adding style to our plot's title
import matplotlib.pyplot as plt

x = range(1, 11)
y = [10, 20, 15, 35, 40, 30, 50, 55, 75, 50]

plt.plot(x, y)

# Adding styles using parameters
plt.title(
    "Your Chart's Title",
    fontsize='large',
    loc='left',
    fontweight='bold',
    style='italic',
    family='monospace')
plt.show()
This returns the following plot:
Adding a Subtitle to a Matplotlib Plot
There may be many times that you want to add subtitles to a Matplotlib plot. While Matplotlib doesn’t actually offer a subtitle method, it does offer a .suptitle() method. This method acts as a higher-level title. We can then use the regular title as a subtitle.
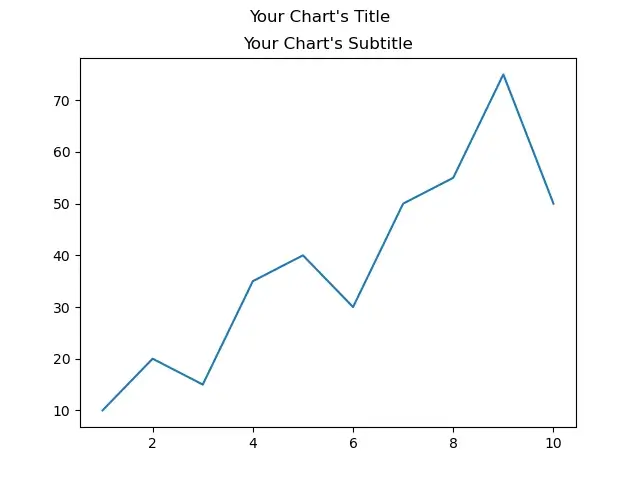
Let’s see how we can use the .suptitle() method along with the .title() method to add a subtitle to our plot:
# Adding a subtitle to our plot
import matplotlib.pyplot as plt

x = range(1, 11)
y = [10, 20, 15, 35, 40, 30, 50, 55, 75, 50]

plt.plot(x, y)

# Adding a Title and Subtitle
plt.suptitle("Your Chart's Title")
plt.title("Your Chart's Subtitle")
plt.show()
This returns the following image:
While this is an official way to add a subtitle to a Matplotlib plot, it does provide the option to visually represent a subtitle.
In the next section, you’ll learn how to add and style axis labels in a Matplotlib plot.
Adding Axis Labels to a Matplotlib Plot
In this section, you’ll learn how to add axis labels to your Matplotlib plot. Axis labels provide descriptive titles to your data to help your readers understand what your dad is communicating.
Matplotlib handles the styling of axis labels in the same way that you learned above. This is part of the incredible flexibility that Matplotlib offers.
We can add axis titles using the following methods:
.xlabel()adds an x-axis label to your plot.ylabel()adds an y-axis label to your plot
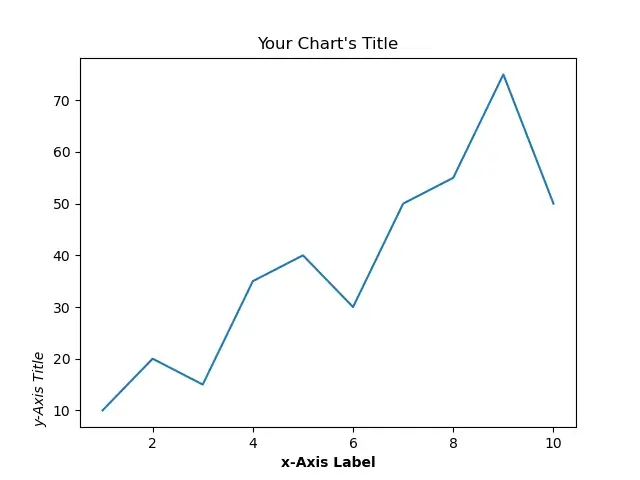
Let’s see how we can add and style axis labels in Matplotlib:
# Adding Axis Labels to a Matplotlib Plot
import matplotlib.pyplot as plt

x = range(1, 11)
y = [10, 20, 15, 35, 40, 30, 50, 55, 75, 50]

plt.plot(x, y)
plt.title("Your Chart's Title")

# Adding and styling axis labels
plt.xlabel('x-Axis Label', fontweight='bold')
plt.ylabel('y-Axis Title', style='italic', loc='bottom')
plt.show()
This returns the following image:
Adding a Titles to Matplotlib Subplots
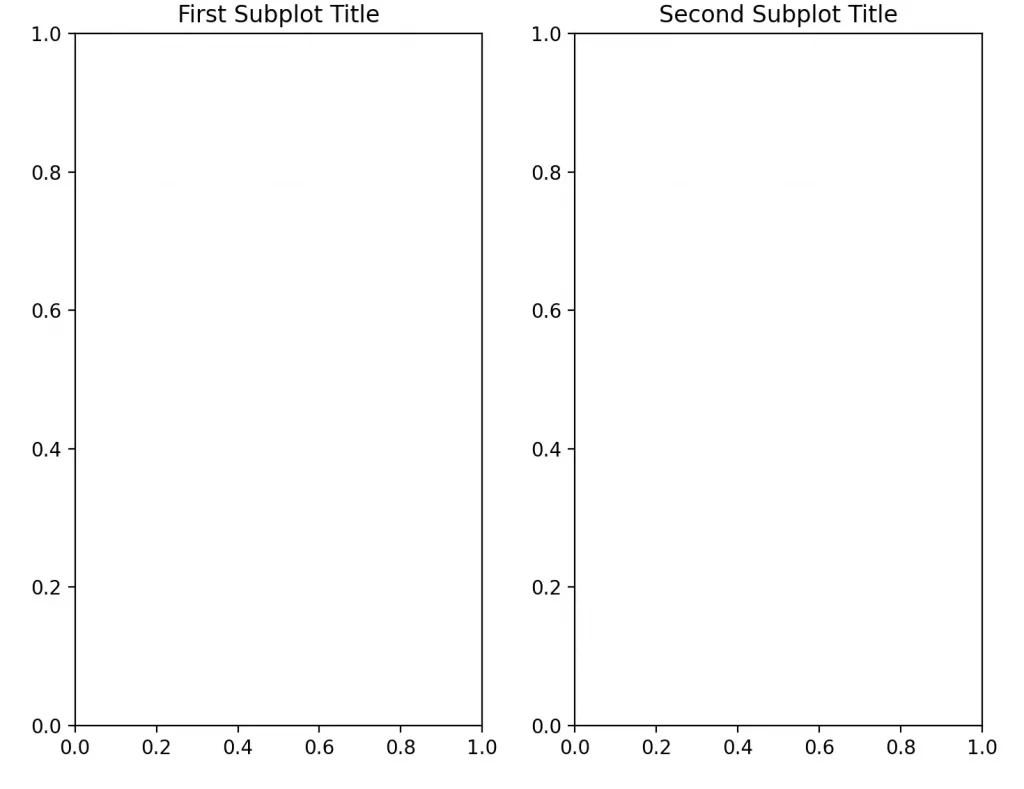
Matplotlib also makes it very easy to add titles to Matplotlib subplots. This can be done by accessing the subplot using its axes position and using the .set_title() method. Similarly, the .set_title() method works as the other text elements do.
Let’s see how we can add titles to our plot’s subplots:
import matplotlib.pyplot as plt

fig, ax = plt.subplots(1,2)
fig.tight_layout()

# Adding titles to subplots
ax[0].set_title('First Subplot Title')
ax[1].set_title('Second Subplot Title')

plt.show()
This returns the following image:
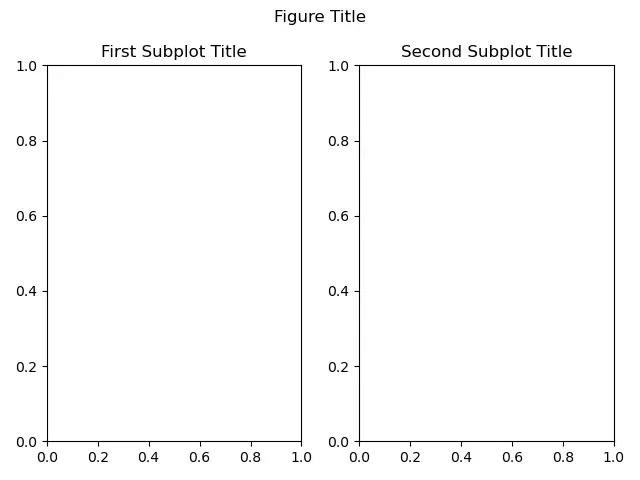
If we wanted to add a global title to our plot, we can make use of the .suptitle() method, as we did above. This can be helpful when you want to add a title to the entire figure. Because of this, we apply the method to the figure.
# Adding a title to a figure
import matplotlib.pyplot as plt

fig, ax = plt.subplots(1,2)

# Adding titles to subplots
ax[0].set_title('First Subplot Title')
ax[1].set_title('Second Subplot Title')

# Adding a title to the figure
fig.suptitle('Figure Title')

fig.tight_layout()
plt.show()
This returns the following image:
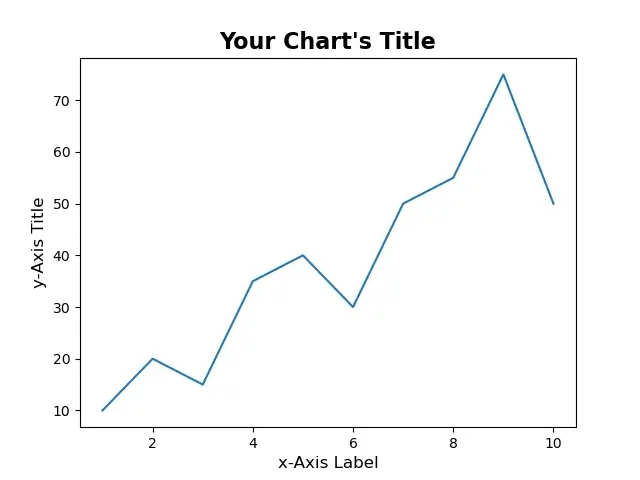
Changing Styles of Matplotlib Titles Globally
When you’re working in creating plots programmatically in Matplotlib, you’ll likely want to set styles at a global level. This means that you are able to apply the styles by way of a dictionary. Matplotlib allows us to set up a parameter dictionary that can be applied to all visualizations.
Let’s see what this looks like:
# Styling Matplotlib Plots with rcParams
import matplotlib.pyplot as plt

x = range(1, 11)
y = [10, 20, 15, 35, 40, 30, 50, 55, 75, 50]

# Defining Parameters
params = {
    'axes.titlesize': 16,
    'axes.labelsize': 12,
    'axes.titleweight':'bold'
}

# Updating the rcParams in Matplotlib
plt.rcParams.update(params)

plt.plot(x, y)
plt.title("Your Chart's Title")
plt.xlabel('x-Axis Label')
plt.ylabel('y-Axis Title')
# plt.show()
This returns the following image:
If you’re curious about the different rcParams that are available, you can print them using the plt.rcParams.keys() method.
Resetting Matplotlib Title Styles to Default Values
Once you’ve set the rcParams in Matplotlib, you may want to reset these styles in order to ensure that the next time you run your script that default values are applied. Matplotlib stores the default values in the rcParamsDefault attribute.
In order to restore values to their default values, we can use the .update() method again and pass in the default values:
# Restoring rcParams back to default values
plt.rcParams.update(plt.rcParamsDefault)
Conclusion
In this tutorial, you learned how to use Matplotlib to add titles, subtitles, and axis labels to your plots. You also learned how to control the style, size, and position of these titles. You also learned how to control these titles globally and how to reset values back to their default values.
Additional Resources
To learn more about related topics, check out the tutorial below: