
In this tutorial, you’ll learn how to implement the sigmoid activation function in Python. Because the sigmoid function is an activation function in neural networks, it’s important to understand how to implement it in Python. You’ll also learn some of the key attributes of the sigmoid function and why it’s such a useful function in deep learning.
By the end of this tutorial, you’ll have learned:
- What the sigmoid function is and why it’s used in deep learning
- How to implement the sigmoid function in Python with numpy and scipy
- How to plot the sigmoid function in Python with Matplotlib and Seaborn
- How to apply the sigmoid function to numpy arrays and Python lists
Table of Contents
What is the Sigmoid Function?
A sigmoid function is a function that has a “S” curve, also known as a sigmoid curve. The most common example of this, is the logistic function, which is calculated by the following formula:

When plotted, the function looks like this:
You may be wondering how this function is relevant to deep learning. The sigmoid function is often used as an activation function in deep learning. This is because the function returns a value that is between 0 and 1. Similarly, since the step of backpropagation depends on an activation function being differentiable, the sigmoid function is a great option. Finally, the derivate of the function can be expressed in terms of itself.
How to Implement the Sigmoid Function in Python with numpy
While numpy doesn’t provide a built-in function for calculating the sigmoid function, it makes it easy to develop a custom function to accomplish this. Let’s see how we can accomplish this:
# Developing the Sigmoid Function in numpy
import numpy as np

def sigmoid(x):
    return 1.0 / (1.0 + np.exp(-x))
In the function above, we made use of the numpy.exp() function, which raises e to the power of the negative argument.
Let’s see how we can make use of the function by passing in the value of 0.5:
# Testing Out Our Sigmoid Function
import numpy as np

def sigmoid(x):
    return 1.0 / (1.0 + np.exp(-x))
print(sigmoid(0.5))

# Returns: 0.6224593312018546
Similarly, in many deep learning models, you’ll encounter the function written as an anonymous lambda function. Let’s see how we can convert the above function into a lambda function:
# Developing the Sigmoid Function in numpy as a Lambda Function
import numpy
sigmoid = lambda x: 1.0 / (1.0 + numpy.exp(-x))
In some tutorials, you’ll see this implemented with the math library. However, I don’t recommend this approach for the following two reasons:
- The
math.exp()function will result in NaN values with extreme negative values - You’ll likely need to import numpy anyway, so using numpy may result in fewer imports
In the next section, you’ll learn how to implement the sigmoid function in Python with scipy.
How to Implement the Sigmoid Function in Python with scipy
When using the scipy library, you actually have two options to implement the sigmoid logistic function:
scipy.stats.logistic()scipy.special.expit()
The first of these is actually just a wrapper for the second, which can result in a slower implementation.
Let’s see how we can implement the function using scipy:
# Using scipy to Implement the Sigmoid Function
from scipy.special import expit
print(expit(0.5))

# Returns: 0.6224593312018546
How to Apply the Sigmoid Function to numpy Arrays
In many cases, you’ll want to apply the sigmoid function to more than a single value. In most cases, these values will be stored in numpy arrays. Thankfully, because of the way numpy arrays are implemented, doing this is actually very easy. Let’s see how this is done:
# Applying the Sigmoid Function to numpy Arrays
import numpy as np

def sigmoid(x):
    return 1.0 / (1.0 + np.exp(-x))

arr = np.array([-2, -1.5, -1, 0, 1, 1.5, 2])

print(sigmoid(arr))

# Returns: [0.11920292 0.18242552 0.26894142 0.5 0.73105858 0.81757448 0.88079708]
How to Apply the Sigmoid Function to Python Lists
In some cases, you’ll also want to apply the function to a list. Because of the way we implemented the function, it needs to be applied to each value. The simplest way to do this is to use a list comprehension, which allows us to loop over each element and apply the function to it, as shown below:
# Applying the Sigmoid Function to a List of Values
import numpy as np

def sigmoid(x):
    return 1.0 / (1.0 + np.exp(-x))

values = [-2, -1.5, -1, 0, 1, 1.5, 2]
print([sigmoid(value) for value in values])

# Returns: [0.11920292 0.18242552 0.26894142 0.5 0.73105858 0.81757448 0.88079708]
How to Plot the Sigmoid Function in Python with Matplotlib
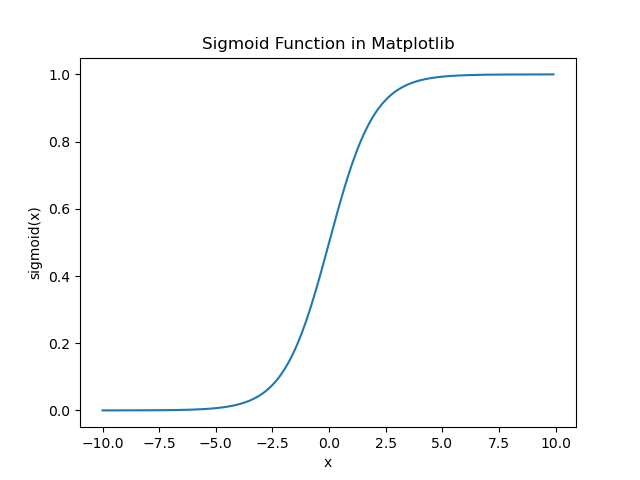
In this section, we’ll explore how to plot the sigmoid function in Python with Matplotlib. Being able to plot the function is a great way to understand how the function works and why it’s a great fit for deep learning.
Let’s first implement the code and then explore how we accomplished what we did:
# Plotting the Sigmoid Function in Python with Matplotlib
import numpy as np
import matplotlib.pyplot as plt

def sigmoid(x):
    return 1.0 / (1.0 + np.exp(-x))

values = np.arange(-10, 10, 0.1)

plt.plot(values, sigmoid(values))
plt.xlabel('x')
plt.ylabel('sigmoid(x)')
plt.title('Sigmoid Function in Matplotlib')
plt.show()
This returns the following image:
Conclusion
In this tutorial, you learned how to implement the sigmoid function in Python. First, you learned what the function is and how it relates to deep learning. Then you learned how to implement the function using both numpy and scipy. Then, you learned how to apply the function to both numpy arrays and Python lists. Finally, you learned how to plot the function using Matplotlib.
Additional Resources
To learn more about related topics, check out the tutorials below: