
In this tutorial, you’ll learn how to change the plot and figure sizes in Matplotlib. Data visualization is a valuable tool to help you communicate your data. Being able to customize exactly how your plots are sized gives you the flexibility to produce your desired results. This allows you to produce print-ready visualizations.
By the end of this tutorial, you’ll have learned:
- How to change the plot and figure size using measurements in inches
- How to set the DPI of a plot and figure
- How to change the size of a plot by a factor of its size
Table of Contents
Loading a Sample Plot
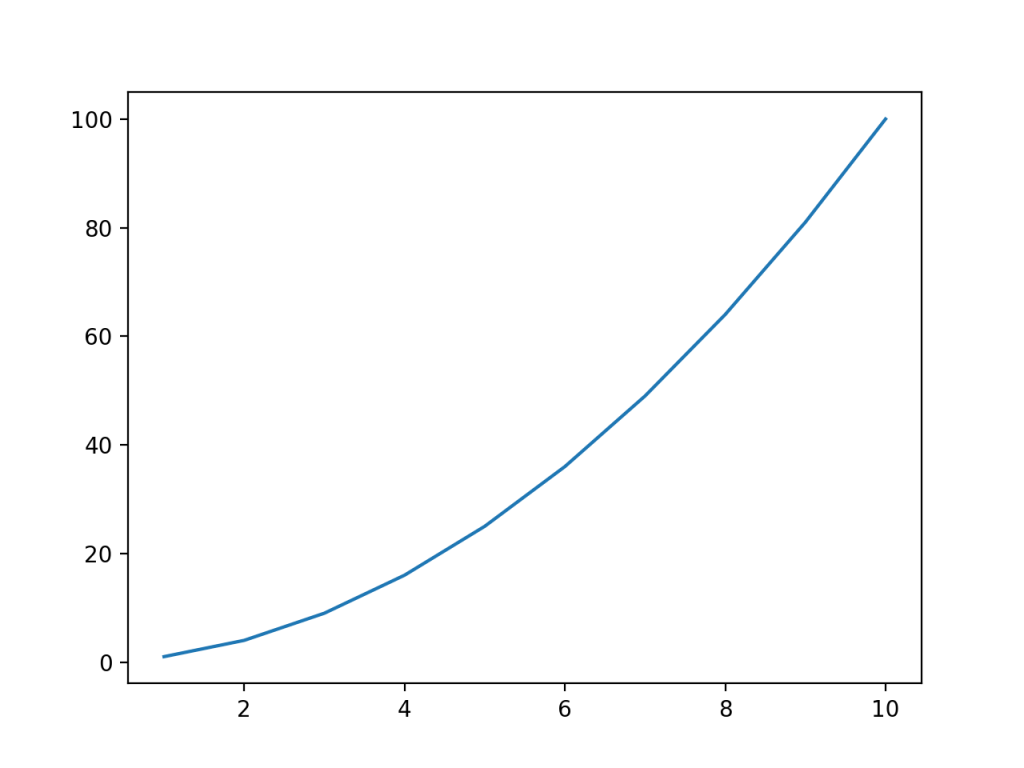
To follow along with this tutorial line by line, copy and paste the code below into your favourite code editor. We’ll be using a simple plot for this tutorial, in order to really focus on how to change the figure size of your plot in Matplotlib.
# Loading a Sample Plot
import matplotlib.pyplot as plt

x = range(1, 11)
y = [i**2 for i in x]

plt.plot(x, y)
plt.show()
This returns the following image:
Let’s break down what we did here:
- We loaded the
pyplotmodule asplt - We defined
xvalues as the values from 1 through 10 - We then used a Python list comprehension to define the
yvalues as the square of eachxvalue - We then passed these variables into the
plt.plot()function - Finally, we used the
.show()method to display the visualization
Changing Plot Size in Matplotlib Using figsize
One of the simplest and most expressive ways of changing the plot size in Matplotlib is to use the figsize= argument. As the name of the argument indicates, this is applied to a Matplotlib figure. Because of this, we first need to instantiate a figure in which to host our plot.
Let’s take a look at how we can do this:
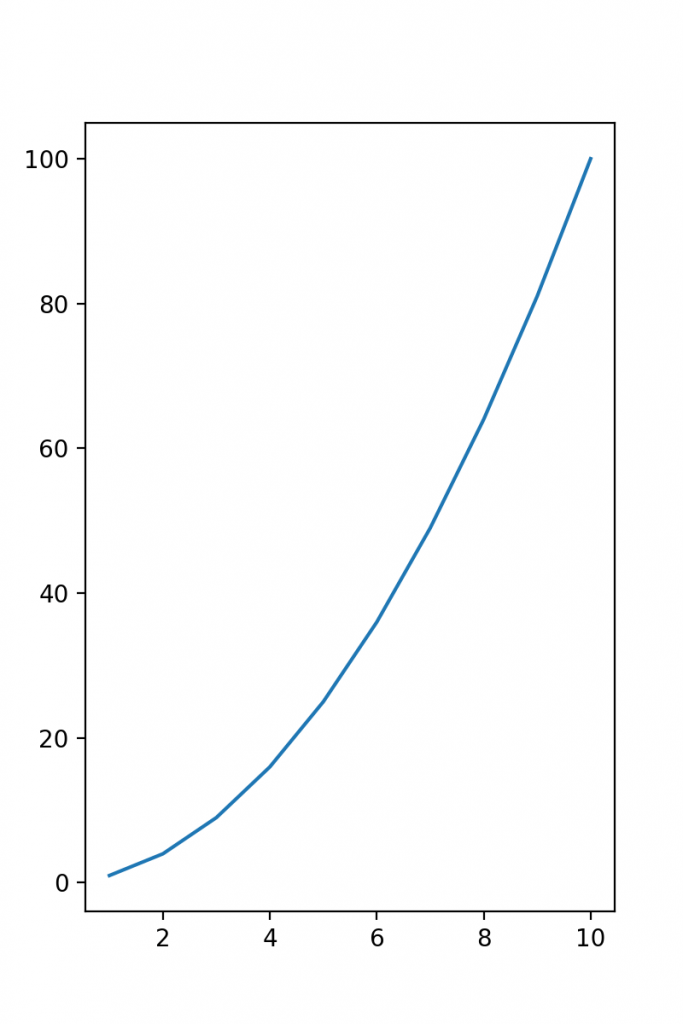
# Changing the figure size using figsize=
import matplotlib.pyplot as plt

x = range(1, 11)
y = [i**2 for i in x]

plt.figure(figsize=(5, 5))
plt.plot(x, y)
plt.show()
This returns the following image:

In the code above, we accessed the Figure that was created by default. In the code above, we assigned the figsize= parameter in order to specify the size of the figure we want to use. We passed in a tuple containing the width and the length in inches.
If you’re more accustomed to working with centimeters, you first need to convert the measurement to centimeters. This can be done by multiplying a value in inches by 2.54 to calculate it in centimeters.
Setting the DPI of a Matplotlib Figure
Matplotlib allows you to prepare print-friendly reports. In order to finely tune your printable reports, you can also control the DPI of the charts your produce. By default, Matplotlib uses a DPI of 100 pixels per inch. In order to mofidy this, you can use the dpi= parameter on the figure object.
Let’s change our DPI to 200 pixels per inch:
# Changing the DPI of a Matplotlib Chart
import matplotlib.pyplot as plt

x = range(1, 11)
y = [i**2 for i in x]

plt.figure(figsize=(5, 5), dpi=200)
plt.plot(x, y)
plt.show()
This returns the following image:

In the next section, you’ll learn how to use Matplotlib to set width and height individually.
Changing Plot Size in Matplotlib Using set_figheight and set_figwidth
Matplotlib also provides ways to more explicitly define the height and width individually, using the set_fightheight() and set_figwidth() functions. While the previous section showed you how to change the size in one argument, these functions give you the control to modify these parameters individually.
Let’s see how we can use these functions to modify the size of our plot in Matplotlib:
# Using Figure Functions to Change Matplotlib Chart Size
import matplotlib.pyplot as plt

x = range(1, 11)
y = [i**2 for i in x]

# Create a figure
fig = plt.figure()

# Set the width and height
fig.set_figwidth(4)
fig.set_figheight(6)

# Create an axes
ax = fig.add_subplot(1, 1, 1)
ax.plot(x, y)
plt.show()
This returns the following image:
Let’s break down what we did here:
- We declared a figure object
- We then used the
set_figwidth()andset_figheight()functions to control the figure size - We then declared a subplot axes and added our plot
In the next section, you’ll learn how to use the rcParams in Matplotlib to change plot sizes.
Changing Plot Size in Matplotlib Using rcParams
We can change the figure size in Matplotlib globally using the rcParams available. This allows you to produce multiple visualizations and only modify the size a single time. This can be very valuable when you want to generate multiple plots and need them all to be the same size.
Let’s see how we can use rcParams to control the figure size in Matplotlib:
# Using rcParams to Change Figure Size in Matplotlib
import matplotlib.pyplot as plt

x = range(1, 11)
y = [i**2 for i in x]

plt.rcParams['figure.figsize'] = (8, 4)
plt.plot(x, y)
plt.show()
This returns the following image:

In the code above, we accessed the rcParams dictionary key for figure.figsize in order to pass in a tuple that contained the width and height of the figure.
Conclusion
In this tutorial, you learned how to change the figure size of a Matplotlib plot. You learned how to change the size of a plot using the figsize= parameter. Then, you learned how to use the figure object functions, set_figheight() and set_figwidth() functions to change the size of a Matplotlib plot. Finally, you learned how to use rcParams to change the size of a Matplotlib chart. You also learned how to control the DPI of a Matplotlib visualization.
Additional Resources
To learn more about related topics, check out the tutorials below:
To convert inches to centimeters, multiply by 2.54, not divide.
–jh–
Thanks for catching this, Joe! I have fixed the article.