In this tutorial, you’ll learn how to use the Numpy random.normal function to create normal (or Gaussian) distributions. The functions provides you with tools that allow you create distributions with specific means and standard distributions. Additionally, you can create distributions of different sizes.
By the end of this tutorial, you’ll have learned:
- What the normal (Gaussian) distribution is
- How to use the
numpy.random.normal()function create normal distributions - How to specify a mean, a standard deviation, and a shape for your distribution
- How to plot you distributions using Seaborn
Let’s get started!
Table of Contents
What is the Normal (Gaussian) Distribution
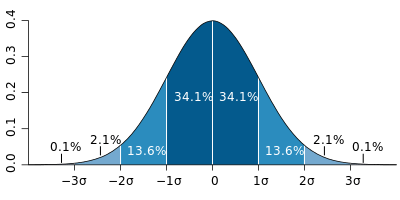
The normal distribution describes a common phenomenon that occurs when data is spread in a certain way. This means that the data aren’t skewed in a particular way, but are also not jumbled all over the place. In fact, they form a bell-curve, similar to the chart below:
You might be thinking to yourself, “how often can this actually happen?” It has a lot, however. For example, heights and weights of people are generally normally-distributed. Similarly, blood pressure, marks on a test, and items produced by machinery.
When we say that data are distributed normally, we mean:
- They are entered along a mean
- They follow conventions around standard deviations
In the image above, the dark blue lines represent 1 standard deviation from the mean in both directions. According to a Gaussian distribution, ~68.2% of values will fall within one standard deviation.
If you want to learn how to check if a distribution is normal, check out my guide on using Python to test for normality.
How to Use Numpy to Create a Normal Distribution
The numpy random.normal function can be used to prepare arrays that fall into a normal, or Gaussian, distribution. The function is incredible versatile, in that is allows you to define various parameters to influence the array. Under the hood, Numpy ensures the resulting data are normally distributed.
Let’s take a look at how the function works:
# Understanding the syntax of random.normal()
normal(
    loc=0.0,        # The mean of the distribution
    scale=1.0,      # The standard deviation
    size=None       # The size or shape of your array
)
While the function only has three parameters, it provides significant opportunity to customize the returned array. Let’s learn a little more about these parameters:
loc=represents the mean (or centre) of the distribution and defaults to 0.0scale=represents the standard deviation and defaults to 1.0size=is a bit more complex. It accepts either an integer or a tuple of integers. If a tuple is passed, a 1-dimensional array of whatever value is passed in. If a tuple, such as (x, y) is passed in, an array of size x * y is returned.
Let’s create your first distribution:
from numpy.random import normal
norm = normal(size=20)
print(norm)

# Returns:
# [-0.96471102  0.97183671  0.64331032  0.17967547  1.13204258  0.82451325
#  -0.15279955  1.07637854  0.4237334  -0.37220927 -1.63307194  0.40096688
#  -0.36214115 -0.18937799 -0.43963889 -0.37077402 -0.20623217 -0.95767066
#   1.60089927  0.45036494]
In the example above, you created a normal distribution with 20 values in it, centred around a mean of 0, with a standard deviation of 1.
In the next section, you’ll learn how to plot this resulting distribution using Seaborn.
How to Plot a Normal Distribution Using Seaborn
In this section, you’ll learn how to visualize the distribution you created using Seaborn. Seaborn specializes in visualizing statistical distributions. In this example, you’ll use the histplot function, which is used to visualize distributions.
Let’s create your first visualization:
# Creating a first visualization
from numpy.random import normal
import matplotlib.pyplot as plt
import seaborn as sns

norm = normal(size=20)
sns.histplot(norm, kde=True)

plt.show()
This returns the following image:

You may the thinking that the distribution doesn’t really look normal. This is because we’ve only pulled 20 values. Let’s create the example with 2000 values and see how the visualization changes:
from numpy.random import normal
import matplotlib.pyplot as plt
import seaborn as sns

norm = normal(size=2000)
sns.histplot(norm, kde=True)

plt.show()
This returns the following image:
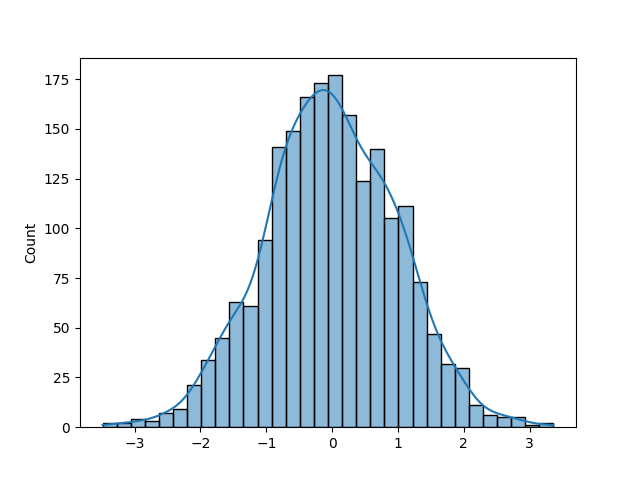
That looks more normal! In the next section, you’ll learn how to modify the mean of the normal distribution using the random normal function in Numpy.
How to Modify the Mean of a Normal Distribution in Python’s Numpy
By default, Numpy’s random.normal() function will use a mean of 0. There will be many times when you want to modify this mean. This is easy to do using the loc= argument. The argument defaults to 0.0, but modifying its value will change the mean of the distribution.
Let’s recreate the example above using a mean of 100:
# Changing the Mean of a Normal Distribution
from numpy.random import normal
import matplotlib.pyplot as plt
import seaborn as sns

norm = normal(loc=100, size=2000)
sns.histplot(norm, kde=True)

plt.show()
This returns the following distribution:
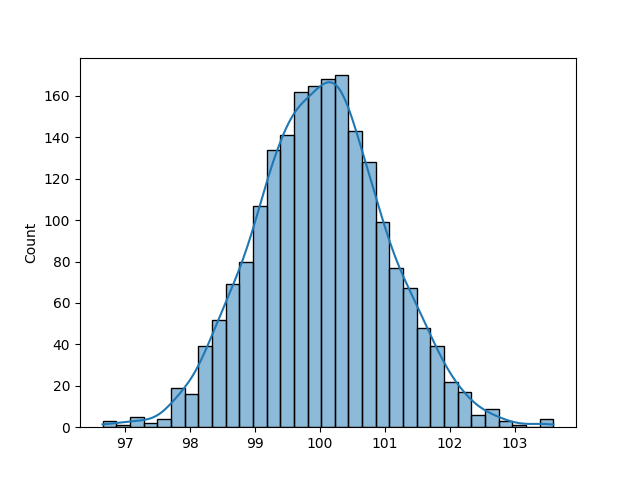
In this case, the distribution looks similar, but the data are centred around 100. In the next section, you’ll learn how to modify the standard deviation of a normal distribution.
How to Modify the Standard Deviation of a Normal Distribution in Python’s Numpy
Similar to how you may want to specify the mean of your resulting distribution, you may also want to modify the standard deviation of the dataset.
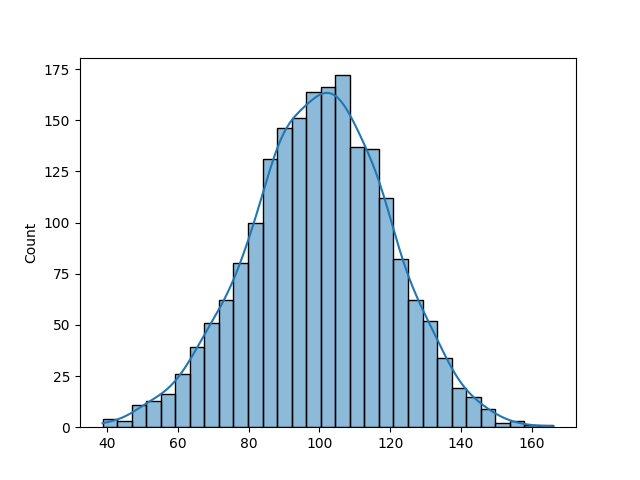
This can be done using the scale= parameter. Let’s change the standard deviation to be 20.
# Modifying the Standard Deviation of a Normal Distribution
from numpy.random import normal
import matplotlib.pyplot as plt
import seaborn as sns

norm = normal(loc=100, scale=20, size=2000)
sns.histplot(norm, kde=True)

plt.show()
This returns the following distribution:
In the next section, you’ll learn how to change the shape of the resulting array.
How to Change the Shape of a Normal Distribution in Numpy
One of the amazing features of the numpy.random normal function is that it allows you to easily define the shape of the resulting array. So far, we have specified an integer value of the size parameter.
When you pass in a tuple of integers, this changes the shape of the array from a 1-dimensional to a multi-dimensional array. Say you pass in a tuple of values (2, 3), you’ll return an array with two rows and three columns.
The resulting array will be normally distributed. Let’s create an example where we create a 2×10 array:
# Changing the shape of a normal array
from numpy.random import normal
norm = normal(loc=100, scale=20, size=(2,10))
print(norm)

# Returns:
# [[108.49943923  78.2338738   88.54610957 115.39467754  86.54653081
#    59.0665876  101.14148334 130.34385877 108.22246364  86.59464058]
#  [110.07354478 129.55607744  76.92302147 147.73941769 153.69210309
#    90.90013017 105.71356503 100.57125782  90.44076092  93.29935961]]
Conclusion
In this tutorial, you learned how to use the Numpy random normal function to create a normal distribution. You learned how to use the function to specify the number of values in the array, the mean of the array, and the standard deviation of the array. You also learned how to use Seaborn to visualize this distribution.
Additional Resources
To learn more about related topics, check out the tutorials below: