Matplotlib is the defacto data visualization library in Python. It provides a ton of options to create beautiful plots and graphs, but many of these amazing features are hidden away in complex documentation. In this tutorial, you’ll learn how to use the retina mode feature, which allows you to enhance the quality of your plots for higher-resolution displays (or printing).
Table of Contents
The Quick Answer: How to Use Retina Mode
To enable retina mode for Matplotlib, you can either use plt.rcParams[‘figure.dpi’] = 200 for inline scripts or enable retina mode for notebooks, using %config InlineBackend.figure_format = 'retina'.
Understanding the Need for Retina Mode in Matplotlib
Matplotlib makes it simple to create graphs in Python, using highly customizable syntax. By default, Matplotlib graphs have a resolution of 100.0 DPI. This resolution, while memory-efficient, is not a very clear resolution.
Let’s take a look comparing two graphs made with Matplotlib:
- Without modifying the resolution (keeping the default 100.0 DPI),
- With an increased resolution of 200.0 DPI
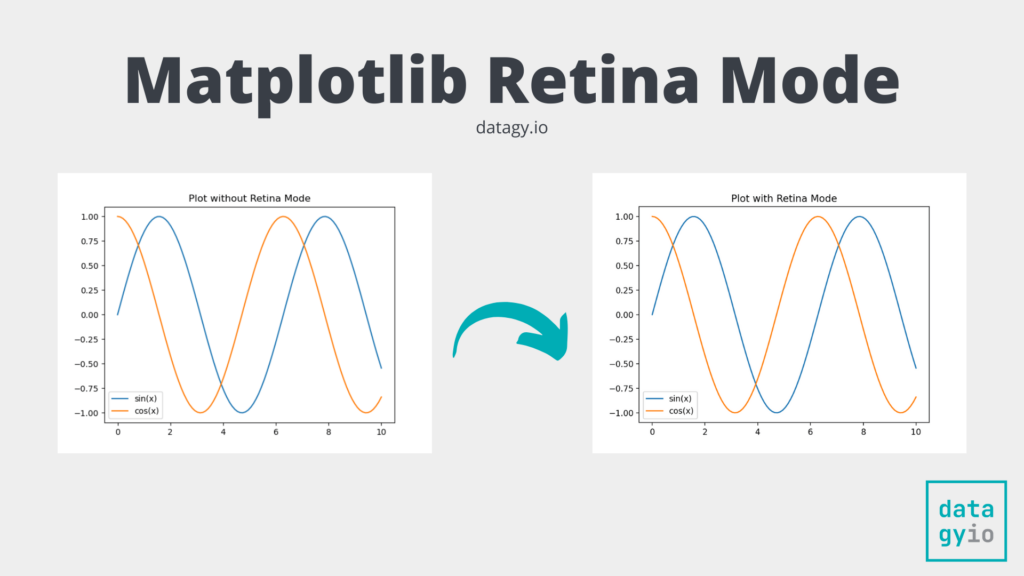
Now that you’ve seen how much better graphs look with retina mode, let’s take a look at how we can accomplish this.
Modifying the Resolution (DPI) of Matplotlib Plots
Matplotlib uses rcParams to control the behavior and appearance of plots. rcParams stands for “runtime configuration parameters” in Matplotlib. It is a dictionary-like object that stores various configuration settings that control the behavior and appearance of Matplotlib’s plots and figures.
The rcParams object allows you to modify and customize the default settings of Matplotlib to suit your preferences. It includes a wide range of parameters, such as figure size, DPI, line styles, colors, fonts, and more.
Let’s see how we can use the rcParams object to modify the DPI of our plot:
# Changing the Resolution of Matplotlib Plots Using rcParams
import matplotlib.pyplot as plt
import numpy as np

plt.rcParams['figure.dpi'] = 200
x = np.linspace(0, 10, 100)
y1 = np.sin(x)
y2 = np.cos(x)

plt.plot(x, y1)
plt.plot(x, y2)
plt.legend(['sin(x)', 'cos(x)'])
plt.title('Plot with Retina Mode')
plt.show()
In the code block above, we used Matplotlib to plot the sin and cos functions. However, we first used the rcParams to set the figure DPI and set it to 200. We also added a legend and a title. When we show the plot, Python returns the following image:

Now, let’s take a look at how to use a simpler retina mode in Jupyter notebooks, if you don’t want to mess with rcParams.
Using Matplotlib Retina Mode in Jupyter Notebooks
Personally, I find rcParams great, but also finicky. Because of this, when working with Jupyter notebooks I prefer to use the Matplotlib magic for retina mode. Jupyter magics allow you to easily modify the behavior of notebooks and how data are represented.
Let’s take a look at how we can use the magic command to switch our mode to retina:
# Using Matplotlib Magic in Jupyter Notebooks
import matplotlib.pyplot as plt
import numpy as np
%config InlineBackend.figure_format='retina'

x = np.linspace(0, 10, 100)
y1 = np.sin(x)
y2 = np.cos(x)

plt.plot(x, y1)
plt.plot(x, y2)
plt.legend(['sin(x)', 'cos(x)'])
plt.title('Plot with Retina Mode')
In the code block above, we were able to use plain language commands to change our display mode to retina. While this approach isn’t as flexible, it can be a bit more intuitive.
Running this code returns the following image:
Conclusion
In conclusion, Matplotlib is an essential data visualization library in Python that offers a wide range of options for creating visually appealing plots and graphs. However, the default resolution of Matplotlib plots may not always provide the desired level of clarity. To address this issue, we explored the concept of Retina Mode in Matplotlib, which allows us to enhance the quality of plots for higher-resolution displays or printing. By increasing the DPI (dots per inch) of the plots, we can achieve crisper and more detailed visualizations.
We learned how to modify the resolution of Matplotlib plots using the rcParams object, which stores various configuration settings for Matplotlib. By adjusting the figure.dpi parameter, we can increase the resolution of our plots and improve their visual quality.
Additionally, for users working with Jupyter notebooks, we introduced the use of the %config InlineBackend.figure_format='retina' magic command. This command provides a simpler way to enable Retina Mode specifically within Jupyter notebooks, without directly modifying the rcParams.
Whether you choose to modify the resolution using rcParams or utilize the magic command in Jupyter notebooks, enabling Retina Mode in Matplotlib allows you to create visually stunning plots that are optimized for high-resolution displays or printing.