In this post, you’ll learn how to calculate a rolling mean in Pandas using the rolling() function. Rolling averages are also known as moving averages.
Creating a rolling average allows you to “smooth” out small fluctuations in datasets, while gaining insight into trends. It’s often used in macroeconomics, such as unemployment, gross domestic product, and stock prices.A moving average is used to create a rolling subset of the full data and calculate the average of that subset. This allows you to smooth out data with high degrees of fluctuation.
By the end of this tutorial, you’ll have learned:
- How to calculate a rolling average in Pandas
- How to understand the syntax of the
.rolling()method - How to change the center of your rolling average
- How to calculate a rolling average of groups using Pandas
.groupby() - How to use the other parameters, such as the relatively new
step=parameter
Updated in 2023 to include more advanced uses, including calculating the rolling mean of groups in your data and the new step= parameter introduced in Pandas version 1.5.
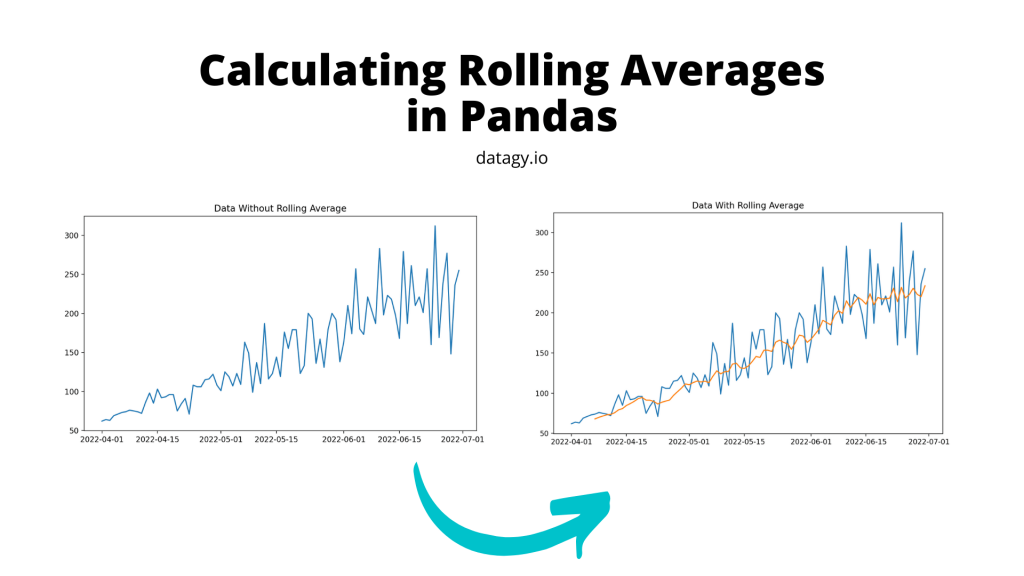
Table of Contents
Loading Our Dataset
Let’s load a dataset to explore the rolling function with. We’ll use the Pandas date_range function to create a range of dates.
import pandas as pd

prices = [62, 64, 63, 69, 71, 73, 74, 76, 75, 74, 72, 86, 98, 85, 103, 92, 93, 96, 96, 75, 84, 91, 71, 108, 106, 106, 115, 116, 122, 108, 101, 125, 119, 107, 123, 109, 163, 149, 99, 137, 110, 187, 116, 123, 144, 119, 176, 155, 179, 179, 123, 133, 200, 193, 136, 167, 131, 179, 200, 192, 138, 164, 210, 174, 257, 180, 173, 221, 204, 187, 283, 198, 223, 218, 198, 168, 279, 187, 261, 210, 221, 201, 257, 160, 312, 169, 239, 277, 148, 236, 255]

dates = pd.date_range('2022-04-01', periods=len(prices))

df = pd.DataFrame(data=zip(dates, prices), columns=['Date', 'Price'])
print(df.head())
We printed out the first five rows, using the head function:
#         Date  Price
# 0 2022-04-01     62
# 1 2022-04-02     64
# 2 2022-04-03     63
# 3 2022-04-04     69
# 4 2022-04-05     71
Explaining the Pandas Rolling() Function
To calculate a moving average in Pandas, you combine the rolling() function with the mean() function. Let’s take a moment to explore the rolling() function in Pandas:
# Understanding the Pandas .rolling() Method
DataFrame.rolling(window, min_periods=None, center=False, win_type=None, on=None, axis=0, closed=None, step=None, method='single')
The table below breaks down the different parameters of the .rolling() method, including their default values and accepted values:
| Parameter | Default Value | Description | Accepted Values |
|---|---|---|---|
| window | Required | The size of the moving window (number of periods to include in the average calculation) | Integer > 0 |
| min_periods | 1 | The minimum number of periods required to have a valid result (ensures there are enough periods in the window for an acceptable average calculation) | Integer >= 0 (If None, defaults to window value) |
| center | False | Indicates whether to set the window at the center of the data points or use a trailing window (True sets the window center, False uses a trailing window) | Boolean (True or False) |
| win_type | None | The window type to use for calculating the average, affecting how the window boundaries are determined. If None, all points are equally weighted. | None or string: {‘boxcar’, ‘triang’, ‘blackman’, ‘hamming’, ‘bartlett’, ‘parzen’, ‘bohman’, ‘blackmanharris’, ‘nuttall’, ‘barthann’, ‘kaiser’, ‘gaussian’, ‘general_gaussian’, ‘slepian’, ‘dpss’, ‘chebwin’, ‘exponential’, ‘tukey’, ‘taylor’} |
| on | None | For a DataFrame, the column on which to calculate the rolling average. If None, uses the index. | Column label or None |
| axis | 0 | The axis along which to compute the rolling average | Integer {0 or 1} or string {‘index’, ‘columns’} |
| closed | ‘right’ | The side of the window interval to close (either both ends, only the right end, or only the left end). Determines which data points are included with ‘right’ being the default | {‘right’, ‘left’, ‘both’, ‘neither’} |
.rolling() methodNow that you have a strong understanding of the .rolling() method, let’s start calculating the rolling average in Pandas.
Creating a Rolling Average in Pandas
Let’s use Pandas to create a rolling average. In the previous section, you learned that the Pandas .rolling() method returns a rolling window of a given size. Let’s assume we wanted to calculate the rolling window of size 7, we can simply pass in the integer 7.
# Calculating a Rolling Mean with Pandas
df['Rolling'] = df['Price'].rolling(7).mean()

print(df.head(10))
This returns:
        Date  Price    Rolling
0 2022-04-01     62        NaN
1 2022-04-02     64        NaN
2 2022-04-03     63        NaN
3 2022-04-04     69        NaN
4 2022-04-05     71        NaN
5 2022-04-06     73        NaN
6 2022-04-07     74  68.000000
7 2022-04-08     76  70.000000
8 2022-04-09     75  71.571429
9 2022-04-10     74  73.142857
Let’s break down what we did here:
- We created a new column using the
rolling()method - We passed in the value of 7 to create a rolling 7 day window
- We then applied the
.mean()method to the calculate the mean of this rolling window
It’s important to note here that we need to pass in a chained method. Otherwise, Python will raise an error. This is where you could pass in different methods in order to calculate other rolling statistics.
Visualizing a Moving Average in Pandas
Let’s create a visualization in order to demonstrate the benefit of the rolling average. To visualize the data without the rolling average, we can write the following code:
# Visualizing data without rolling averages
import matplotlib.pyplot as plt
plt.plot(df['Date'], df['Price'])
plt.title('Data With Rolling Average')

plt.show()
To visualize what effect the rolling average has on smoothing the data, we can plot the two columns in the same chart:
# Plotting the effect of a rolling average
import matplotlib.pyplot as plt
plt.plot(df['Date'], df['Price'])
plt.plot(df['Date'], df['Rolling'])
plt.title('Data With Rolling Average')

plt.show()
This returns the following image:

Modifying the Center of a Rolling Average in Pandas
By default, Pandas use the right-most edge for the window’s resulting values. This is why our data started on the 7th day, because no data existed for the first six.We can modify this behavior by modifying the center= argument to True. This will result in “shifting” the value to the center of the window index.
Let’s see how we can do this in Pandas:
# Modifying the Window Center
df = pd.DataFrame(data=zip(dates, prices), columns=['Date', 'Price'])
df['Rolling'] = df['Price'].rolling(7).mean()

df['Rolling Center'] = df['Price'].rolling(7, center=True).mean()

print(df.head(10))

# Returns:
#         Date  Price    Rolling  Rolling Center
# 0 2022-04-01     62        NaN             NaN
# 1 2022-04-02     64        NaN             NaN
# 2 2022-04-03     63        NaN             NaN
# 3 2022-04-04     69        NaN       68.000000
# 4 2022-04-05     71        NaN       70.000000
# 5 2022-04-06     73        NaN       71.571429
# 6 2022-04-07     74  68.000000       73.142857
# 7 2022-04-08     76  70.000000       73.571429
# 8 2022-04-09     75  71.571429       75.714286
# 9 2022-04-10     74  73.142857       79.285714
We can see that the window was adjusted. Because of this, the rolling data started at the center of the window (which in this case was the 4th record).
Understanding the min_periods Parameter in Pandas Rolling Average
The min_periods parameter plays a crucial role in calculating rolling averages in specific scenarios. Sometimes, having a sufficient number of data points within the moving window is necessary to obtain meaningful results.
The min_periods parameter allows you to specify the minimum number of periods required to produce a valid result for the rolling average calculation. If there aren’t enough periods within the window, the function will return NaN (not-a-number) for that particular rolling window.
This parameter is helpful to handle situations where you have irregular or missing data, or you want to ensure sufficient data points are present for a reliable rolling average calculation.
Let’s explore the min_periods parameter with our previous dataset:
# Modifying the Minimum Periods
import pandas as pd

prices = [62, 64, 63, 69, 71, 73, 74, 76, 75, 74, 72, 86, 98, 85, 103, 92, 93, 96, 96, 75, 84, 91, 71, 108, 106, 106, 115, 116, 122, 108, 101, 125, 119, 107, 123, 109, 163, 149, 99, 137, 110, 187, 116, 123, 144, 119, 176, 155, 179, 179, 123, 133, 200, 193, 136, 167, 131, 179, 200, 192, 138, 164, 210, 174, 257, 180, 173, 221, 204, 187, 283, 198, 223, 218, 198, 168, 279, 187, 261, 210, 221, 201, 257, 160, 312, 169, 239, 277, 148, 236, 255]

dates = pd.date_range('2022-04-01', periods=len(prices))
df = pd.DataFrame(data=zip(dates, prices), columns=['Date', 'Price'])

df['With Min Periods'] = df['Price'].rolling(window=4, min_periods=2).mean()
print(df.head())

# Returns:
#         Date  Price  With Min Periods
# 0 2022-04-01     62               NaN
# 1 2022-04-02     64             63.00
# 2 2022-04-03     63             63.00
# 3 2022-04-04     69             64.50
# 4 2022-04-05     71             66.75
Let’s break down what this code block is doing:
- We start by creating a DataFrame
dfwith our sample data. - We then call the
rolling()method on the'Price'column with a window size of 4 periods andmin_periods=2as an argument. This indicates that we require a minimum of 2 data points within the moving window to produce a valid result. If there are less than 2 data points, the calculation will yield NaN. - We then use the
mean()function to calculate the rolling average for each window. - Finally, we assign this to a new column,
'With Min Periods'
By using the min_periods parameter, we can effectively manage situations where a minimum amount of data is necessary for meaningful rolling average calculations. This is useful to avoid potential biases or errors when handling irregular or incomplete data in the analysis.
Calculating a Rolling Average with a GroupBy Object in Pandas
There might be cases when you need to calculate the rolling average for different groups within your dataset. This is when combining the groupby method with the rolling average feature becomes very useful. In this section, we will demonstrate how to use the groupby object to calculate rolling averages for distinct groups, using a dataset where we add an additional column to represent each group.
First, let’s create a sample Pandas DataFrame with a ‘group’ column:
# Adding a Group to Our DataFrame
import pandas as pd

data = {
    'date': pd.date_range(start='1/1/2021', periods=15),
    'value': [1, 4, 6, 4, 5, 3, 6, 8, 10, 7, 6, 4, 2, 1, 3],
    'group': ['A', 'A', 'B', 'B', 'A', 'A', 'B', 'B', 'A', 'A', 'B', 'B', 'A', 'A', 'B']
}

df = pd.DataFrame(data)
Now, let’s compute the rolling average for each group using a window of 3 periods:
# Calculating the Rolling Average Across Groups
df['Avg'] = df.groupby('group')['value'].transform(lambda x: x.rolling(3, 3).mean())
print(df.head(7))

# Returns:
#          date  value group       Avg
# 0  2021-01-01      1     A       NaN
# 1  2021-01-02      4     A       NaN
# 2  2021-01-03      6     B       NaN
# 3  2021-01-04      4     B       NaN
# 4  2021-01-05      5     A  3.333333
# 5  2021-01-06      3     A  4.000000
# 6  2021-01-07      6     B  5.333333
Let’s break down what we did in the code block above:
- First, we use
df.groupby('group')to group the data by the ‘group’ column. In our example, we have two groups: ‘A’ and ‘B’. - We then apply the rolling average calculation for the ‘value’ column by chaining
['value'].rolling(window=3, min_periods=3). This tells Pandas to compute the rolling average for each group separately, taking a window of 3 periods and a minimum of 3 period for a valid result. - We use the
mean()function to calculate the actual rolling average for each window within the groups.
The rolling_avg_group DataFrame now contains the rolling average values for each group (A and B), calculated independently.
Calculate a Rolling Mean in Pandas with a Step Count
In case you want to calculate a rolling average using a step count, you can use the step= parameter. This parameter is relatively new, being introduced only in Pandas 1.5.
This works in the same way as first slicing the original data using [::step], but saves you the trouble of needing to step over your DataFrame. In order to calculate a stepped rolling average in Pandas, you can use the following:
df['Stepped Rolling'] = df['Price'].rolling(3, step=3).mean()
print(df.head(7))

# Returns:
#         Date  Price  Stepped Rolling
# 0 2022-04-01     62              NaN
# 1 2022-04-02     64              NaN
# 2 2022-04-03     63              NaN
# 3 2022-04-04     69        65.333333
# 4 2022-04-05     71              NaN
# 5 2022-04-06     73              NaN
# 6 2022-04-07     74        72.666667
We can see that the first value is produced after three full values exist. The average is then only produces for each third value.
Conclusion
In this tutorial, you learned how to calculate a rolling average in Pandas. You learned what a rolling average is and why it’s useful. You then learned how to use the Pandas rolling function to calculate a rolling window which was used to apply the .mean() method to. You also learned how to visualize the data as well as how to change the center of the rolling window.
Additional Resources
To learn more about related topics, check out the tutorials below:
- Pandas Mean: Calculate Pandas Average for One or Multiple Columns
- Matplotlib Line Charts – Learn all you need to know
- To learn more about the rolling function, check out the official documentation.