Python allows you to work with floating point values in standard notations and scientific notation. In this tutorial, you’ll learn how to use scientific notation to convert and suppress floating point values to and from scientific notation. Scientific notation refers to numbers being expressed in the power of 10.
By the end of this tutorial, you’ll have learned:
- What scientific notation is and when you may want to use it
- How to use scientific notation in Python when creating new floating point values
- How to suppress scientific notation
- How to remove scientific notation from Python graphs, such as in Matplotlib
Table of Contents
What is Scientific Notation?
Scientific notation is a way of expressing very large or very small numbers using an exponent of base 10. This allows you to easily identify the scope of a value, generally a decimal value. In order to convert a number to its scientific notation counterpart, you can simply set the first number (or the coefficient) to be between 1 and 10. Then multiply the number by its base ten value.
For example, to convert 342 to scientific notation:
- Make 3 the coefficient
- 42 become the values following the decimal
- The value is then multiplied by 102
This means that 342 becomes 3.42×10².
When Does Python Use Scientific Notation?
One important thing to note is that Python will never store your values as scientific notation. They will always be stored as either integers or floating-point values. Python will, however, display the values in scientific notation when appropriate.
This begs the question – when does Python display values as scientific notation? Python will display values as scientific notation when they are bigger than 1×10¹⁵ or smaller than 1×10⁻⁴. In these cases, Python’s REPL will for the values to be displayed as scientific notation.
Let’s take a look at an example of what this looks like:
# Reviewing Displaying Values as Scientific Notation
print(123456789123456789.5)
print(0.00000001)

# Returns:
# 1.2345678912345678e+17
# 1e-08
Now that you know when Python will use scientific notation, let’s take a look at how you can force Python to display values in their decimal form.
How to Use Python to Convert Scientific Notation to Decimal Values
In order to suppress scientific notation in Python, we can use string formatting. This allows you to represent the values in their decimal format. However, this will also convert the values into a string, so it’s best to not overwrite the variables themselves.
Let’s see how we can suppress scientific notation by using f-strings.
# Suppressing Scientific Notation in Python with f-strings
value = 0.0000123
print("value without supression: ", value)
print(f"value with supression: {value:.7f}")

# Returns:
# value without supression:  1.23e-05
# value with supression: 0.0000123
In the example above, we created a variable that would be represented as 1.23e-05 in scientific notation. We then used string formatting in our f-string to display the values as a floating decimal with 7 point precision.
You may be wondering how we landed on 7 points of precision? Since our scientific notation is of base 5 and we have two decimal values, we add 5 + 2, to give us 7 points of precision.
How to Use Python to Convert Floating Point Values to Scientific Notation
There may be times when you want to convert a regular number format to its scientific notation equivalent. For this, you can, again, use f-string formatting. Recall from the previous section that this represents the value as a string, rather than as a number. Because of this, it’s important not to overwrite the original variable.
Let’s see how we can use f-strings to convert a number to its scientific notation representation:
# Converting a Number to Scientific Notation in Python
value = 342
print("value without scientific notation: ", value)
print(f"value with scientific notation: {value:e}")

# Returns:
# value without scientific notation:  342
# value with scientific notation: 3.420000e+02
In the example above, we used the string formatter of e to represent that we want the values to be expressed in scientific notation.
How to Load a Number As Scientific Notation in Python
Python also allows you to easily create values as scientific notation. This can be helpful when you want to create precise values, without needing to worry about their values expressed as large or small numbers. Let’s see how we can create the value of 342 using it’s scientific notation counterpart:
# Creating a Value From Scientific Notation
value = float(3.42e2)
print("value as float: ", value)
print(f"value as scientific notation: {value:e}")

# Returns:
# value without scientific notation:  342.0
# value with scientific notation: 3.420000e+02
In the code block above, we passed in 3.42e2 into the float() constructor function. This allowed us to create a floating point value from its scientific notation representation. If you, instead, wanted to create an integer value, you could simply use the int() constructor function.
How to Remove Scientific Notation from Matplotlib Graphs
By default, Matplotlib will convert very large and very small values to scientific notation. While this can work for scientific papers, it’s often not a preferred way of showing values within a business context.
Let’s create a visualization and see how values are displayed:
# Creating a Visualization with Scientific Notation
import numpy as np
import matplotlib.pyplot as plt

x = np.linspace(1, 100, 100)
y = np.linspace(1e-10, 1e-8, 100)

plt.plot(x, y)
plt.show()
In the code block above, we used the NumPy linspace function to create a range of values in a linear space.
This returns the following image:
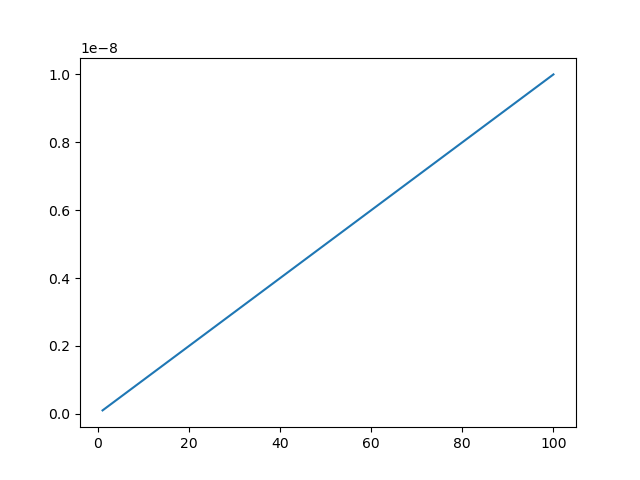
We can modify the values in the y-axis by using the .ticklab_format() function. By default, Matplotlib will use the style of 'sci' for scientific. We can change the formatting to 'plain' to use the values in their floating point values.
Let’s see how this can be done in Matplotlib:
# Creating a Visualization without Scientific Notation
import numpy as np
import matplotlib.pyplot as plt

x = np.linspace(1, 100, 100)
y = np.linspace(1e-10, 1e-8, 100)

plt.plot(x, y)
plt.ticklabel_format(style='plain')
plt.show()
This returns the following image:

Conclusion
In this tutorial, you learned how to use scientific notation in Python. You first learned what scientific notation is and when you may want to use it. Then, you learned how scientific notation is used in Python to express very large and very small values. From there, you learned how to represent values as either scientific notation or how to suppress scientific notation in Python. Then, you learned how scientific notation can also be used to create floats and integers. Finally, you learned how to use Matplotlib to hide scientific notation on an axis.
Additional Resources
To learn more about related topics, check out the tutorials below: