Python makes it simple to display data in table format using the tabulate() function from the tabulate library. This can be a helpful way of understanding your data, rather than simply printing lists, dictionaries, or other Python objects. In this tutorial, you’ll learn how to display Python data in table formats, how to customize the outputs with styles, indices, and missing values.
Table of Contents
Quick Answer: How to Display Data in Table Format in Python
How to Display Data in a Table Format in Python
- Import the tabulate function from tabulate
Run the following code
from tabulate import tabulate - Pass your data (such as a list of lists) into the tabulate function
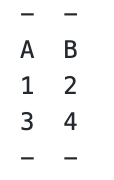
Pass a data structure into the function, such as this:
data = [['A', 'B'], [1, 2], [3, 4]]result = tabulate(data) - Print your resulting table
To print the data, print out your resulting table using
print(result)
How to Use Tabulate in Python to Print Tables
Tabulate is a Python library that allows you to easily display your data using printable tables that can have different styles and advanced customization options, such as working with indices, missing data, and number formatting.
Because the library doesn’t come pre-built into Python, we first need to install it. This can be done using the pip package manager. In order to do this, use the following command in your Terminal or command line:
pip install tabulateOnce the library is installed, we can import the tabulate() function from the tabulate library, as shown below:
# Importing the tabulate Function
from tabulate import tabulate
Now that our function is imported, let’s define some custom data to visualize. Tabulate allows you to work with data in many different formats. While we’ll be using a list of lists, tabulate allows you to use the following Python data structures:
- list of lists or another iterable of iterables
- list or another iterable of dicts (keys as columns)
- dict of iterables (keys as columns)
- list of dataclasses (Python 3.7+ only, field names as columns)
- two-dimensional NumPy array
- NumPy record arrays (names as columns)
- pandas.DataFrame
Let’s define a list of lists containing some sample data:
# Create Sample Data
data = [
    ['Name', 'Age', 'Location'],
    ['Nik', 31, 'Toronto'],
    ['Kate', 30, 'London'],
    ['Evan', 35, 'Tokyo'],
    ['Kyra', 36, 'Ottawa']
]
In order to create a table out of this data, it’s as simple as passing it into the tabulate() function, as shown below:
# Printing a Tabulate Table with Default Styling
print(tabulate(data))

# Returns:
# ----  ---  --------
# Name  Age  Location
# Nik   31   Toronto
# Kate  30   London
# Evan  35   Tokyo
# Kyra  36   Ottawa
# ----  ---  --------
And voila! We’ve built our first table successfully. We can see that the information are aligned nicely and that the information is much more readable than before. One of the things you might notice is that the headers of the data aren’t discerned. Let’s tackle this problem in the next section.
Adding Headers to Tables in Python with Tabulate
By default, Python tables created with Tabulate don’t discern between data and a header. In order to accomplish this, we need to pass values into the headers= argument. In order to keep working with the same list of lists, we can split it by slicing our list.
Let’s create a new set of lists: one that contains our headers (the first item) and one that contains our data (everything else). We can then pass these lists into the tabulate() function. Let’s see what this looks like:
# Printing a Table with Headers
data_header = data[0]
data_values = data[1:]
print(tabulate(data_values, headers=data_header))

# Returns:
# Name      Age  Location
# ------  -----  ----------
# Nik        31  Toronto
# Kate       30  London
# Evan       35  Tokyo
# Kyra       36  Ottawa
In the example above, we passed data into the headers= argument and the positionally-first argument for the data. We can now see that the data are split between headers and data elements. This allows readers to better understand the meaning behind your data.
Styling Python Tables with Tabulate
Tabulate also provides many different built-in styles. While the default style is a very simplistic style, you can also create more stylized versions if you want to. In fact, the library provides over 20 different styles! Let’s explore just a few of them here.
You can access all the available styles by using the following method:
# Viewing all available Tabulate styles
from tabulate import _table_formats
print(_table_formats.keys())

# Returns:
# dict_keys(['simple', 'plain', 'grid', 'fancy_grid', 'fancy_outline', 'github', 'pipe', 'orgtbl', 'jira', 'presto', 'pretty', 'psql', 'rst', 'mediawiki', 'moinmoin', 'youtrack', 'html', 'unsafehtml', 'latex', 'latex_raw', 'latex_booktabs', 'latex_longtable', 'tsv', 'textile'])
By default, Tabulate will use the 'simple' style.
Understanding the Grid Style in Tabulate
In order to apply a style, you can use the tablefmt= parameter and pass in a string representing the styles. Let’s take a look at what the 'grid' style looks like:
# Using 'Grid' Style
print(tabulate(
    data_values,
    headers=data_header,
    tablefmt='grid')
    )

# Returns:
# +--------+-------+------------+
# | Name   |   Age | Location   |
# +========+=======+============+
# | Nik    |    31 | Toronto    |
# +--------+-------+------------+
# | Kate   |    30 | London     |
# +--------+-------+------------+
# | Evan   |    35 | Tokyo      |
# +--------+-------+------------+
# | Kyra   |    36 | Ottawa     |
# +--------+-------+------------+
Understanding the Fancy Grid Style in Tabulate
One of the most popular styles is the fancy grid style, which adds elegant borders and clean lines to your data:
# Using 'Fancy Grid' Style
print(tabulate(
    data_values,
    headers=data_header,
    tablefmt='fancy_grid')
    )

# Returns:
# ╒════════╤═══════╤════════════╕
# │ Name   │   Age │ Location   │
# ╞════════╪═══════╪════════════╡
# │ Nik    │    31 │ Toronto    │
# ├────────┼───────┼────────────┤
# │ Kate   │    30 │ London     │
# ├────────┼───────┼────────────┤
# │ Evan   │    35 │ Tokyo      │
# ├────────┼───────┼────────────┤
# │ Kyra   │    36 │ Ottawa     │
# ╘════════╧═══════╧════════════╛
Understanding the Pipe Style in Tabulate to Create Markdown Tables
In order to create markdown tables in Tabulate, you can use the 'pipe' style, which gives you tables you can easily use for different applications. Let’s see what this looks like:
# Using 'Pipe' Style
print(tabulate(
    data_values,
    headers=data_header,
    tablefmt='pipe')
    )

# Returns:
# | Name   |   Age | Location   |
# |:-------|------:|:-----------|
# | Nik    |    31 | Toronto    |
# | Kate   |    30 | London     |
# | Evan   |    35 | Tokyo      |
# | Kyra   |    36 | Ottawa     |
Note that this even includes the required alignment guides using colons.
Understanding the Pretty Style in Tabulate
Finally, let’s take a look at the 'pretty' style, which adds some flair to your tables using different symbols:
# Using 'Pretty' Style
print(tabulate(
    data_values,
    headers=data_header,
    tablefmt='pretty')
    )

# Returns:
# +------+-----+----------+
# | Name | Age | Location |
# +------+-----+----------+
# | Nik  | 31  | Toronto  |
# | Kate | 30  |  London  |
# | Evan | 35  |  Tokyo   |
# | Kyra | 36  |  Ottawa  |
# +------+-----+----------+
Now that you have discovered some of the different styles available, let’s dive into some other functionality. First, we’ll explore how to add an index to your tables.
Adding an Index to Python Tables with Tabulate
By default, Tabulate won’t include an index in your tables. In many ways, this makes sense since the original data likely didn’t include an explicit index. However, since many Python data structures such as lists are indexable, we can include this index in our data.
In order to include an index in a Python table with tabulate, we can use the showindex= parameter, as shown below:
# Displaying an Index in a Table
print(tabulate(
    data_values,
    headers=data_header,
    tablefmt='fancy_grid',
    showindex='always')
    )

# Returns:
# ╒════╤════════╤═══════╤════════════╕
# │    │ Name   │   Age │ Location   │
# ╞════╪════════╪═══════╪════════════╡
# │  0 │ Nik    │    31 │ Toronto    │
# ├────┼────────┼───────┼────────────┤
# │  1 │ Kate   │    30 │ London     │
# ├────┼────────┼───────┼────────────┤
# │  2 │ Evan   │    35 │ Tokyo      │
# ├────┼────────┼───────┼────────────┤
# │  3 │ Kyra   │    36 │ Ottawa     │
# ╘════╧════════╧═══════╧════════════╛
Including this index can be a helpful way to add row numbers to your tables, which can make the data even easier to understand.
Working with Missing Values in Python Tables with Tabulate
So far in this tutorial, we have worked only with complete datasets. However, you likely already know that most datasets you’ll encounter aren’t complete and often include missing data.
In this section, we’ll explore how Tabulate allows you to work with missing data. In order to do this, let’s create a new list of lists which includes some None values.
# Inserting Missing Data
data_missing = [
    ['Name', 'Age', 'Location'],
    ['Nik', 31, None],
    ['Kate', None, 'London'],
    ['Evan', 35, 'Tokyo'],
    ['Kyra', 36, 'Ottawa']
]
In the newly-created list of lists, we have included a few None values, which will allow us to understand how Tabulate handles this type of information. Let’s pass this list into the tabulate() function and check out what the default behavior is:
# How Tabulate Shows Missing Data
print(tabulate(data_missing))

# Returns:
# ----  ---  --------
# Name  Age  Location
# Nik   31
# Kate       London
# Evan  35   Tokyo
# Kyra  36   Ottawa
# ----  ---  --------
We can see from the code block above that, by default, Tabulate simply doesn’t print missing values.
You can customize the behavior of missing values in Python tables with tabulate by using the missingval= parameter, which accepts a string to format missing values. Let’s pass in the string of 'NA' to have a consistent handling of missing values:
# Formatting Missing Values with Tabulate
print(tabulate(
    data_missing,
    missingval='NA'))

# Returns:
# ----  ---  --------
# Name  Age  Location
# Nik   31   NA
# Kate  NA   London
# Evan  35   Tokyo
# Kyra  36   Ottawa
# ----  ---  --------
We can see that by customizing the way in which missing numbers are handled, it can become much more clear as to what data is missing. This will give readers much more insight into how to interpret your data.
Applying Custom Number Formatting in Python Tables
In this final section, we’ll explore how to apply custom number formatting to your tabulate tables. So far, we have worked only with strings and integers. In many cases, however, you’ll encounter long floating point values.
In order to customize how these values are displayed, you can use the floatfmt= parameter, which allows you to use common number formatting to customize how values are printed.
Let’s load the values of pi and the Euler’s constant, e, into a table and cut off precision at four decimal points.
# Applying Custom Float Formatting
print(tabulate(
    [["pi",3.141593],["e",2.718282]],
    floatfmt=".4f"))

# Returns:
# --  ------
# pi  3.1416
# e   2.7183
# --  ------
In the code block above, we created a new list of lists containing two floating point values. We then used the format string '.4f' which specifies four degrees of precision following a decimal point. We can see that in the resulting table that the floating point values are truncated.
Conclusion
In conclusion, the tabulate library in Python provides a powerful and flexible tool for displaying data in tabular format, offering various styles and customization options. By leveraging the tabulate() function, you can transform raw data structures, such as lists of lists or dictionaries, into neatly formatted tables. This not only enhances the readability of your data but also facilitates a better understanding of its structure. The tutorial covered essential aspects, including importing the library, creating tables with and without headers, applying different styles such as ‘grid’ and ‘fancy_grid’, handling missing values, adding indices, and customizing number formatting.
Tabulate’s versatility is highlighted through its support for various data structures, including lists, dictionaries, NumPy arrays, pandas DataFrames, and more. Additionally, the ability to choose from over 20 different styles allows users to tailor the visual representation of their tables to suit specific preferences or application requirements. Whether you need a simple and clean output or a more sophisticated and visually appealing table, tabulate offers the tools to achieve both. By mastering the techniques covered in this tutorial, you are well-equipped to present your data in a structured and visually compelling manner, enhancing the overall clarity and interpretability of your information.
There is much more to the tabulate library. I encourage you to check out the official documentation to gain an even deeper understanding of the library.