Understanding the certainty and reliability of your data is essential in drawing meaningful conclusions. Confidence intervals give you a powerful statistical tool, which helps you estimate the range in which a population parameter, such as the mean, lies. In this tutorial, you’ll learn three different methods to calculate confidence intervals in Python.
By the end of this tutorial, you’ll have learned how to do the following:
- Understand what the confidence interval is used for
- How to calculate the confidence interval based on small (<30) sample data
- How to calculate the confidence interval for larger samples
- How to use bootstrapping to calculate the confidence interval in Python
Table of Contents
Understanding Confidence Intervals in Statistics
Confidence intervals are used in statistics to quantify the uncertainty around an estimated parameter from a sample. For example, when you calculate the mean of a sample, you may want to understand how this compares to the mean of a broader population. However, due to sampling, the two means likely won’t match. This is where confidence intervals come into play: they provide a range of values within which we can reasonably expect the true population parameter to lie, given a certain level of confidence.
The confidence level that is associated with a confidence interval is used to show the probability that the interval contains the true population parameter. The confidence level that you choose is up to you. In many cases, levels of 90%, 95%, and 99% are used but they vary based on the context of your data and the degree of confidence that you need.
A wider interval implies greater certainty, while a narrower one suggests more precision. However, factors such as sample size and variability also influence the width of the confidence interval. In fact, larger sample sizes tend to result in narrower intervals as they provide more information about the population.
Now that you have a good understanding of confidence intervals, let’s dive into how to calculate them in Python!
Calculating Confidence Intervals in Python for Small Samples (t distribution)
When working with small sample sizes, such as those with less than 30 observations, or when the population standard deviation is unknown, the t-distribution is used to calculate confidence intervals.
To calculate the confidence interval with the t-distribution, we can use the formula below:
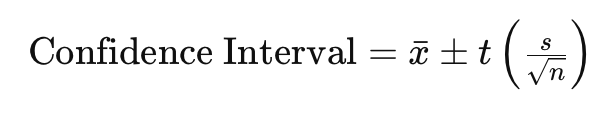
Where:
- xˉ is the sample mean.
- s is the sample standard deviation.
- n is the sample size.
- t is the critical value from the t-distribution based on the desired confidence level and degrees of freedom (df=n−1).
In Python, we can use popular library like SciPy and NumPy that make calculating confidence intervals using the t-distribution simple. From the formula definition above, we can see that we need a few items, namely the mean and the standard deviation.
Let’s start by importing our libraries and loading some sample data as a NumPy array.
# Importing Libraries and Loading Sample Data
import numpy as np
from scipy.stats import t

sample_data = [25, 28, 30, 32, 29, 27, 31, 26, 28, 30]
sample = np.array(sample_data)
In the code block above, we first imported the NumPy library using the alias np. We then imported the t distribution from the scipy.stats module. Finally, we created an array containing sample data. We’re using a small sample of only ten values in this case.
In order to calculate our confidence intervals, we first need to calculate our sample’s mean and standard deviation. Because we’re working with a sample, we’ll calculate our standard deviation using a degree of freedom of 1.
# Calculating Mean and Standard Deviation
sample_mean = np.mean(sample)
sample_std = np.std(sample, ddof=1)

print(f'{sample_mean=}')
print(f'{sample_std=}')

# Returns:
# sample_mean=28.6
# sample_std=2.2211108331943574
In the code block above, we used the NumPy functions to calculate both the mean and the standard deviation of the sample. This will allow us to more easily calculate the confidence interval later on. Finally, let’s calculate our degrees of freedom. In this case, this is simply the length of our sample minus 1.
# Calculating Degrees of Freedom
n = len(sample)
df = n - 1

print(f'Degrees of Freedom: {df}')

# Returns:
# Degrees of Freedom: 9
Ok, perfect – we now have everything we need to calculate our confidence intervals! We can use the t module we imported earlier to get our critical t value. In order to do this, we can use the t.ddf() function. Into this function, we’ll pass in our the range to select (in this case, we want 2.5% on either end) and the degrees of freedom we’re working with.
# Calculating the Confidence Interval for a Small Sample
confidence_level = 0.95
alpha = 1 - confidence_level

t_critical = t.ppf(1 - alpha / 2, df)
margin_of_error = t_critical * (sample_std / np.sqrt(n))
lower_bound = sample_mean - margin_of_error
upper_bound = sample_mean + margin_of_error

print(f"Confidence Interval: ({lower_bound}, {upper_bound})")

# Returns:
# Confidence Interval: (27.011113026588347, 30.188886973411655)
From here, we can simply recreate the formula shown above. This allows us to calculate the margin of error, which we can subtract from and add to our sample mean to calculate the confidence interval.
Because this is a common enough problem to solve, the SciPy library actually comes with a built-in function for doing this. We can use the t.interval() function to calculate the confidence interval directly. Let’s see how this works:
# Calculate the Confidence Interval with a t-Distribution Directly
confidence_interval = t.interval(
    confidence_level,
    df,
    loc=sample_mean,
    scale=sample_std / np.sqrt(n)
    )
print(confidence_interval)

# Returns:
# (27.011113026588347, 30.188886973411655)
In the code block above, we used the t.interval() function to calculate our confidence interval directly. in order to this, we need to pass in our confidence level, our degrees of freedom, our sample mean and the scale (which is standard deviation divided by the square root of the sample size.
What’s great about this function besides abstracting away the complexities is that it returns a single tuple containing our whole confidence interval! This allows us to more easily calculate the values without needing to instantiate two variables.
Now that you have learned how to calculate confidence intervals for samples of size 30 or smaller, let’s explore how to use the z-distribution to calculate them for larger samples.
Calculating Confidence Intervals in Python for Large Samples (z-distribution)
When you’re working with large sample sizes (such as those larger than 30), or when the population standard deviation is known, you can use the z-distribution to estimate the confidence intervals.
In many ways, the formula for calculating confidence intervals for larger samples is similar to that of smaller samples. The key difference is that we used the critical z-score, rather than the critical t-score. Let’s take a look at the formula that is used to calculate the confidence interval for large samples:

Where:
- xˉ is the sample mean.
- σ is the population standard deviation.
- n is the sample size.
- z is the critical value from the z-distribution based on the desired confidence level.
Similar to the previous method, SciPy provides a helpful function for calculating the confidence interval, the interval() function. This function is part of the scipy.stats module.
Let’s take a look at how we can calculate the confidence interval for a larger sample in Python:
# Calculating Confidence Intervals for Larger Samples
import numpy as np
from scipy.stats import t

sample_data = [54, 48, 56, 65, 47, 47, 65, 57, 45, 55, 45, 45, 52, 30, 32, 44, 39, 53, 40, 35, 64, 47, 50, 35, 44, 51, 38, 53, 43, 47, 43, 68, 49, 39, 58, 37, 52, 30, 36, 51, 57, 51, 48, 46, 35, 42, 45, 60, 53, 32]

# Sample statistics
sample_mean = np.mean(sample_data)
sample_std = np.std(sample_data, ddof=1)
n = len(sample_data)
confidence_level = 0.95

# Calculate standard error (population standard deviation unknown)
standard_error = sample_std / np.sqrt(n)

# Degrees of freedom for t-distribution
df = n - 1

# Calculate confidence interval using t.interval()
confidence_interval = t.interval(confidence_level, df, loc=sample_mean, scale=standard_error)

print(f"Confidence Interval: {confidence_interval}")

# Returns:
# Confidence Interval: (44.49377461388924, 49.82622538611076)
There’s a lot going on in the code block above. Let’s break it down, step-by-step:
- We first import our required libraries and load a sample dataset.
- We then calculate the mean, standard deviation, and length of our dataset
- We then calculate the standard error by dividing the standard deviation by the square root of the length of the dataset.
- We also define our degrees of freedom, which in this case is equal to the length minus 1
- Finally, we calculate the confidence interval by using the
scipy.stats.interval()function
In the following section, we’ll explore another method for calculating confidence intervals, the bootstrapping method.
Calculating Confidence Intervals in Python Using Bootstrapping
So far, all of the methods that have taken a look rely on assumptions of the distribution, specifically that the distribution is normal. In some cases, this assumption won’t hold and that’s where the bootstrapping method comes into play.
Bootstrapping is a resampling technique that generates multiple samples by randomly sampling with replacement from the observed data. The method then estimates the uncertainty of a statistic by quantifying the variation seen across the resampled datasets.
A naive way of implementing the bootstrap method is to do the following:
- Resample your data
ntimes with replacement and calculate the mean for each sample - Find the confidence interval by getting percentiles of the bootstrapped means
Let’s see how we can use Python to calculate the bootstrapped confidence interval for a mean:
# Using Bootstrapping to Calculate the Confidence Interval
import numpy as np

# Given sample data
sample_data = [54, 48, 56, 65, 47, 47, 65, 57, 45, 55, 45, 45, 52, 30, 32, 44, 39, 53, 40, 35, 64, 47, 50, 35, 44, 51, 38, 53, 43, 47, 43, 68, 49, 39, 58, 37, 52, 30, 36, 51, 57, 51, 48, 46, 35, 42, 45, 60, 53, 32]

# Number of bootstrap samples
num_samples = 1000  # You can adjust the number of bootstrap samples as needed

# Empty list to store bootstrap sample means
bootstrap_means = []

# Performing bootstrapping
for _ in range(num_samples):
    # Generate bootstrap sample by resampling with replacement
    bootstrap_sample = np.random.choice(sample_data, size=len(sample_data), replace=True)
    # Calculate the mean of the bootstrap sample and store it
    bootstrap_means.append(np.mean(bootstrap_sample))

# Calculate the confidence interval (using percentiles)
confidence_interval = np.percentile(bootstrap_means, [2.5, 97.5])  # For a 95% confidence interval

print(f"Bootstrapped Confidence Interval of the Mean: {confidence_interval}")

# Returns:
# Bootstrapped Confidence Interval of the Mean: [44.56   49.9005]
Let’s break down what we’re doing in the code block above:
- We import NumPy and generated a sample dataset
- We define the number of samples we want to create using our bootstrapping method
- We instantiate an empty list to hold our bootstrapped means
- We then create a loop to randomly sample our list with replacement and calculate the mean of that sample and append it to our list
- We then use the percentile function to calculate the cut-off points for our means. We use 2.5 and 97.5 to calculate the 95% confidence interval.
We can simplify this process significantly by using SciPy to calculate the confidence intervals. In order to this, we first need to import the bootstrap() function from the stats module in the library. Let’s see how we can use the function to calculate the confidence interval:
# How to Use SciPy to Calculate Confidence Intervals Using Bootstrapping
from scipy.stats import bootstrap
import numpy as np

ci = bootstrap((sample_data,), np.mean, n_resamples=1000).confidence_interval
print(ci)

# Returns:
# ConfidenceInterval(low=44.73998471169268, high=49.47524079806603)
We can see that this code is much simpler and generates a fairly similar result. Keep in mind that the intervals will likely vary, since we’re randomly sampling multiple times.
Bootstrapping has many applications. In fact, the popular data visualization library Seaborn uses bootstrapping in many of its graphs to add confidence intervals.
Conclusion
Understanding confidence intervals is vital for assessing the reliability of conclusions drawn from data analysis. These intervals offer a range within which a population parameter is likely to reside, considering a chosen level of confidence. Whether dealing with smaller samples and using the t-distribution, or larger samples with the z-distribution, these methods provide tools to estimate these intervals.
For smaller samples, employing the t-distribution involves meticulous steps like calculating sample statistics, degrees of freedom, and critical values. Python’s libraries like SciPy and NumPy simplify this process, enabling precise calculations. Conversely, larger samples utilize the z-distribution, where the population standard deviation plays a crucial role in determining the confidence intervals.
Additionally, the bootstrapping method offers a distribution-free approach, especially beneficial when assumptions about data distribution aren’t met. By resampling data and computing means from these resampled sets, bootstrapping generates confidence intervals without assuming a specific data distribution, enhancing the robustness of statistical analyses. Through these varied approaches, Python proves to be an invaluable tool for confidently deriving insights from data.
To learn more about the t module in SciPy, check out the official documentation.