In this tutorial, you’ll learn how to use the Pandas shift method to move a Pandas Dataframe column up or down. Being able to shift data is an important skill, especially when working with time series data or when you want to calculate the different between consecutive rows.
The Pandas shift() method does just this, allowing you to shift data forward or backward, and even allowing you to define the shifting of time series data across different intervals. You’ll learn how to move data forward or backward, filling newly missing data, and dealing with time series data.
If you’re familiar with SQL, the Pandas shift method is very similar to the LAG() and LEAD() functions available via the popular window functions.
The Quick Answer: Use Pandas shift
.shift() method explainedTable of Contents
Pandas Shift Explained
The Pandas shift method is a relatively straightforward method that opens up your analysis to significant opportunities. For example, you can compare differences between subsequent rows.
Coming from other data analysis applications (such as Excel), it may seem like a good idea to compare the rows, record by record. However, iterating over a Pandas Dataframe is a slow process (find out why in my tutorial on this topic).
This is where Pandas shift comes in. It gives you the opportunity to compare rows at different intervals in a vectorized format.
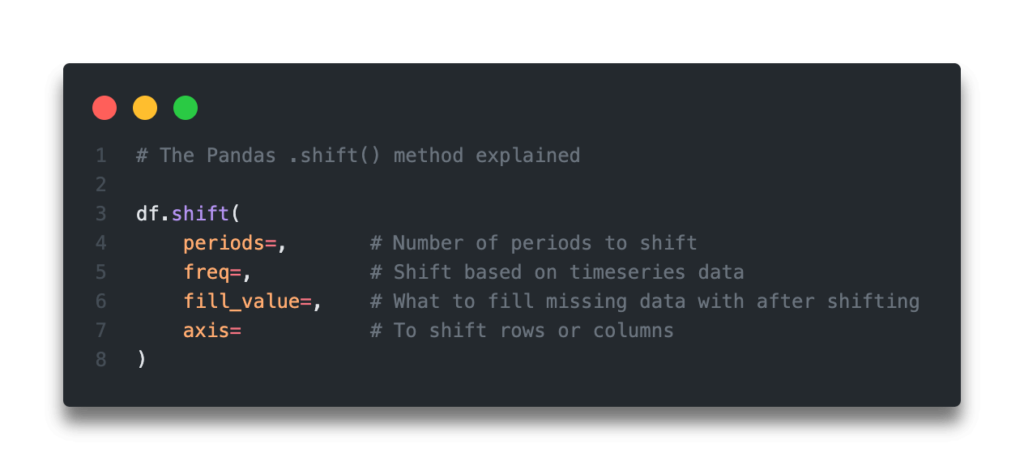
Let’s take a look at how the Pandas shift method works and what its arguments are:
df.shift(
    periods=,       # Number of periods to shift
    freq=,          # Shift based on timeseries data
    fill_value=,    # What to fill missing data with after shifting
    axis=           # To shift rows or columns
)
Let’s take a look at what the Pandas shift method’s parameters do:
| Argument | Data Type | Explanation |
|---|---|---|
periods= | int | The number of periods to shift data by. Can be positive or negative. |
freq= | DateOffset, tseries.offsets, timedelta, or str, optional | The offset to use for different time series data. If the index is not set to a time series, then an error will be raised. |
fill_value= | object, optional | The scalar to fill data with. The datatype is inferred from the column itself, unless a different datatype is passed in. |
axis= | {0 or ‘index’, 1 or ‘columns’, None}, default None | The direction in which to shift |
.shift() methodLoading a Sample Pandas Dataframe
To follow along word for word with this tutorial, I have provided a sample Pandas Dataframe that you can load. Simply copy and paste that code below into your favourite code editor and we can get started:
# Load a Sample Pandas Dataframe
import pandas as pd

df = pd.DataFrame.from_dict({
    'Name': ['Nik', 'Jane', 'Kate', 'Evan', 'Max', 'Kevin', 'Luke'],
    'Amount': [100, 200, 210, 120, 70, 95, 90]
})

print(df.head())

# Returns:
#    Name  Amount
# 0   Nik     100
# 1  Jane     200
# 2  Kate     210
# 3  Evan     120
# 4   Max      70
We can see here that we’ve loaded a dataframe with different columns and then printed the first five records using the Pandas df.head() method.
In the next section, you’ll learn how to shift an entire dataframe using the Pandas shift method.
Shift an Entire Dataframe Using Pandas Shift
There may be times when you want to move all records in a Pandas Dataframe either up or down. When we apply the .shift() method to a dataframe itself, then all records in that dataframe are shifted.
One of the Pandas .shift() arguments is the periods= argument, which allows us to pass in an integer. The integer determines how many periods to shift the data by.
If the integer passed into the periods= argument is positive, the data will be shifted down. If the argument is negative, then the data are shifted upwards.
Let’s try moving out records down by one row using Pandas:
# Shift an Entire Pandas dataframe
import pandas as pd
df = pd.DataFrame.from_dict({'Name': ['Nik', 'Jane', 'Kate', 'Evan', 'Max', 'Kevin', 'Luke'], 'Amount': [100, 200, 210, 120, 70, 95, 90]})

# Print the Original Dataframe
print('Original dataframe')
print(df.head())

# Shift the dataframe and reprint it
df = df.shift(periods=1)
print('\nShifted Dataframe')
print(df.head())
# Returns:
# Original dataframe
#    Name  Amount
# 0   Nik     100
# 1  Jane     200
# 2  Kate     210
# 3  Evan     120
# 4   Max      70

# Shifted Dataframe
#    Name  Amount
# 0   NaN     NaN
# 1   Nik   100.0
# 2  Jane   200.0
# 3  Kate   210.0
# 4  Evan   120.0
We can see here that the original data are shifted down by one row.
If we wanted to move our data up by one row instead, then we can pass in periods=-1. Let’s give this a shot:
# Shift an Entire Pandas dataframe
import pandas as pd
df = pd.DataFrame.from_dict({'Name': ['Nik', 'Jane', 'Kate', 'Evan', 'Max', 'Kevin', 'Luke'], 'Amount': [100, 200, 210, 120, 70, 95, 90]})

# Print the Original Dataframe
print('Original dataframe')
print(df.head())

# Shift the dataframe and reprint it
df = df.shift(periods=-1)
print('\nShifted Dataframe')
print(df.head())
# Returns:
# Original dataframe
#    Name  Amount
# 0   Nik     100
# 1  Jane     200
# 2  Kate     210
# 3  Evan     120
# 4   Max      70

# Shifted Dataframe
#     Name  Amount
# 0   Jane   200.0
# 1   Kate   210.0
# 2   Evan   120.0
# 3    Max    70.0
# 4  Kevin    95.0
In the next section, you’ll learn how to shift the values of only a single column in a Pandas Dataframe.
Shifting Dataframe Row Values with Pandas Shift
In the previous section, you learned how to shift an entire dataframe’s rows. In this section, you’ll learn how to shift the values of only a single column. This has many practical applications, such as being able to calculate the difference between consecutive records (which you’ll learn in a later section of this tutorial).
The way that we can accomplish this in Pandas is to apply the function to a Pandas series (i.e., a column), rather than to the entire dataframe. While you don’t need to assign a new column when you do this (you could just re-assign it to itself), we’ll create a new column to illustrate how this works.
In the example below, we’ll shift the Amount column down one record and call it Amount (Shifted):
# Shift a single column in a Pandas dataframe
import pandas as pd
df = pd.DataFrame.from_dict({'Name': ['Nik', 'Jane', 'Kate', 'Evan', 'Max', 'Kevin', 'Luke'], 'Amount': [100, 200, 210, 120, 70, 95, 90]})

df['Amount (Shifted)'] = df['Amount'].shift(periods=1)

print(df.head())
# Returns:
#    Name  Amount  Amount (Shifted)
# 0   Nik     100               NaN
# 1  Jane     200             100.0
# 2  Kate     210             200.0
# 3  Evan     120             210.0
# 4   Max      70             120.0
We can see here that the values from the Amount column have shifted down by a single row. If we simply wanted to shift the data, rather than create a new column, you could re-assign the column to itself: df['Amount'] = df['Amount'].shift(periods=1).
You’ll notice that the new column has missing values where the shifted values had been. In the next section, you’ll learn how to fill those missing values when using the Pandas shift method.
Fill Missing Values When Using Pandas Shift
When shifting values in a Pandas Dataframe, you will end up with missing NaN values in the dataframe. The Pandas shift method, thankfully, comes with an argument, fill_value=, which allows you to set a value to fill in.
Let’s see how we can again shift the Amount data down a row and fill the value with 100:
# Shift a single column in a Pandas dataframe and fill missing data
import pandas as pd
df = pd.DataFrame.from_dict({'Name': ['Nik', 'Jane', 'Kate', 'Evan', 'Max', 'Kevin', 'Luke'], 'Amount': [100, 200, 210, 120, 70, 95, 90]})

df['Amount (Shifted)'] = df['Amount'].shift(periods=1, fill_value=100)

print(df.head())
# Returns:
#    Name  Amount  Amount (Shifted)
# 0   Nik     100               100
# 1  Jane     200               100
# 2  Kate     210               200
# 3  Evan     120               210
# 4   Max      70               120
We can see here that the previously missing first row has now been filled with the value of 100.
There may be times where you want to impute the data. For example, if you want the fill value to be dynamic and responsive to changing data, you could fill the data with the mean of the column. We can do this by filling in a function that calculates the mean of the Pandas Dataframe column as the parameter. If you want to learn more about how to calculate the mean in Pandas, check out my tutorial here.
Let’s see how we can fill the missing data with an imputed mean:
# Shift a single column in a Pandas dataframe and fill missing data with an imputed mean
import pandas as pd
df = pd.DataFrame.from_dict({'Name': ['Nik', 'Jane', 'Kate', 'Evan', 'Max', 'Kevin', 'Luke'], 'Amount': [100, 200, 210, 120, 70, 95, 90]})

df['Amount (Shifted)'] = df['Amount'].shift(periods=1, fill_value=df['Amount'].mean())

print(df.head())
# Returns:
#    Name  Amount  Amount (Shifted)
# 0   Nik     100               100
# 1  Jane     200               100
# 2  Kate     210               200
# 3  Evan     120               210
# 4   Max      70               120
In the next section, you’ll learn how to shift time series data with the Pandas shift method.
Shifting Timeseries Data with Pandas Shift
The Pandas shift method can also shift data based on time series data, allowing you to take on complex shifting of data based on different time periods.
In order to demonstrate how this works, let’s generate a new dataframe that has a time series as an index. This part is important: if your index isn’t a time series, then the method will raise an error.
# Load a dataframe with a timeseries index
import pandas as pd
date_range = pd.date_range(start='2021-11-01', end='2021-11-30')
values = [i for i in range(30)]
df = pd.DataFrame.from_dict({'Date':date_range, 'Amount':values}).set_index('Date')

print(df.head())

# Returns:
#             Amount
# Date
# 2021-11-01       0
# 2021-11-02       1
# 2021-11-03       2
# 2021-11-04       3
# 2021-11-05       4
We can see here that we have a new dataframe where the index is a date range and only one extra value exists: an amount that increases from 0 through 30.
Let’s see how we can use the freq= argument to pass in a date time-related interval to shift our dataframe:
# Load a dataframe with a timeseries index and shifting the index
import pandas as pd

date_range = pd.date_range(start='2021-11-01', end='2021-11-30')
values = [i for i in range(30)]
df = pd.DataFrame.from_dict({'Date':date_range, 'Amount':values}).set_index('Date')

df = df.shift(freq='5d')

print(df.head())

# Returns:
#             Amount
# Date
# 2021-11-06       0
# 2021-11-07       1
# 2021-11-08       2
# 2021-11-09       3
# 2021-11-10       4
We can see here that we’ve been able to add ten days to each element in our index. We could also subtract ten days from our index items by changing the date range to a negative frequency.
What’s great about using the freq= argument is that it allows us to maintain the original data while shifting the date ranges that are applied.
In the next section, you’ll learn how to shift Pandas Dataframe columns.
Shift Pandas Dataframe Columns with Pandas Shift
So far in this tutorial, you’ve learned how to shift rows in a Pandas Dataframe. In this section, you’ll learn how to use the axis= argument to be able to shift columns in your dataframe.
# Shift Pandas Dataframe columns
import pandas as pd
df = pd.DataFrame.from_dict({'Name': ['Nik', 'Jane', 'Kate', 'Evan', 'Max', 'Kevin', 'Luke'], 'Amount': [100, 200, 210, 120, 70, 95, 90]})

df = df.shift(periods=1, axis=1)
print(df)

# Returns
#    Name Amount
# 0   NaN    Nik
# 1   NaN   Jane
# 2   NaN   Kate
# 3   NaN   Evan
# 4   NaN    Max
# 5   NaN  Kevin
# 6   NaN   Luke
Let’s break down what we did here: we applied the .shift() method to the entire dataframe, but changed our axis argument to be equal to 1. The returned dataframe had all the columns shifted over by one, while the column names remained the same.
In the next two sections, you’ll learn some applied functions of the Pandas shift method, including how to calculate the difference between consecutive rows and calculating the percentage change between consecutive rows.
Calculate the Difference Between Consecutive Rows in Pandas
There are many times when you may want to calculate the difference between consecutive rows in a Pandas Dataframe. Thankfully, the Pandas shift method makes this a very easy operation.
Let’s see how we can use Pandas to accomplish this:
# Calculating the difference between consecutive rows in a Pandas dataframe
import pandas as pd
df = pd.DataFrame.from_dict({'Name': ['Nik', 'Jane', 'Kate', 'Evan', 'Max', 'Kevin', 'Luke'], 'Amount': [100, 200, 210, 120, 70, 95, 90]})

df['Amount (Shifted)'] = df['Amount'].shift(periods=1, fill_value=0)
df['Amount (Difference)'] = df['Amount'] - df['Amount (Shifted)']

print(df)

# Returns
#     Name  Amount  Amount (Shifted)  Amount (Difference)
# 0    Nik     100                 0                  100
# 1   Jane     200               100                  100
# 2   Kate     210               200                   10
# 3   Evan     120               210                  -90
# 4    Max      70               120                  -50
# 5  Kevin      95                70                   25
# 6   Luke      90                95                   -5
Let’s break down what we’ve done here:
- We create a new column,
Amount (Shifted), which shifts the values down one row and fills any missing values with 0 - We then subtract the two columns to produce the difference between consecutive rows
We could also simplify this procedure by not creating a separate column first and simply writing the entire operation into a single line:
df['Amount (Difference)'] = df['Amount'] - df['Amount'].shift(periods=1, fill_value=0)This saves us the creation of a new column which can add quite a bit of memory usage to our dataframe.
In the next section, you’ll learn how to calculate the percentage difference between consecutive rows in a Pandas Dataframe.
Calculate the Percentage Change Between Consecutive Rows in Pandas
In this section, you’ll learn how to use the Pandas shift method to calculate the percentage difference between consecutive rows in a Pandas Dataframe.
Let’s see how you can do this before we break down how it works:
# Calculating the percentage difference between consecutive rows in a Pandas dataframe
import pandas as pd
df = pd.DataFrame.from_dict({'Name': ['Nik', 'Jane', 'Kate', 'Evan', 'Max', 'Kevin', 'Luke'], 'Amount': [150, 200, 210, 120, 170, 195, 190]})

df['% Difference'] = (df['Amount'] - df['Amount'].shift(periods=1)) / df['Amount'].shift(periods=1)

print(df)
# Returns
#     Name  Amount  % Difference
# 0    Nik     150           NaN
# 1   Jane     200      0.333333
# 2   Kate     210      0.050000
# 3   Evan     120     -0.428571
# 4    Max     170      0.416667
# 5  Kevin     195      0.147059
# 6   Luke     190     -0.025641
In order to calculate the percentage difference between consecutive rows in a Pandas Dataframe, we calculate the difference between consecutive rows and then divide the difference by the shifted value.
Want to learn more about Python for-loops? Check out my in-depth tutorial that takes your from beginner to advanced for-loops user! Want to watch a video instead? Check out my YouTube tutorial here.
Conclusion
In this tutorial, you learned how to use the Pandas shift method to shift rows in a Pandas Dataframe up or down. You also learned how to work with time series data and how to fill missing data created by shifting data. You then learned how to shift Pandas Dataframe columns. Finally, you learned two practical examples, in terms of being able to calculate the difference between rows in Pandas and how to calculate the percentage difference between Pandas rows.
To learn more about the Pandas shift method, check out the official documentation here.