In this tutorial, you’ll learn how to use the Pandas diff method to calculate the difference between rows and between columns. You’ll learn how to use the .diff method to calculate the difference between subsequent rows or between rows of defined intervals (say, every seven rows). You’ll also learned how this is different from the Pandas .shift method and when to use which method. Finally, you’ll learn how to use the Pandas .diff method to plot daily changes using Matplotlib.
The Quick Answer: Pandas diff to Calculate Difference Between Rows
diff: Calculate the difference between rows in a dataframeTable of Contents
Understanding the Pandas diff Method
The Pandas diff method allows us to find the first discrete difference of an element. For example, it allows us to calculate the difference between rows in a Pandas dataframe – either between subsequent rows or rows at a defined interval. Similarly, it also allows us to calculate the different between Pandas columns (though this is a much less trivial task than the former example).
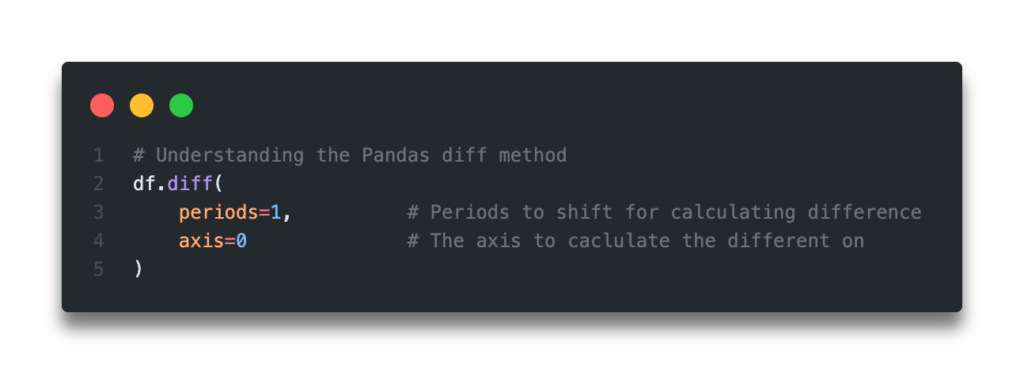
By default, the Pandas diff method will calculate the difference between subsequent rows, though it does offer us flexibility in terms of how we calculate our differences. Let’s take a look at the method and at the two arguments that it offers:
# Understanding the Pandas diff method
df.diff(
    periods=1,          # Periods to shift for calculating difference
    axis=0              # The axis to caclulate the different on
)
We can see that the Pandas diff method gives us two parameters:
periods=let’s us define the number of periods (rows or columns) to shift in order to calculate the differenceaxis=let’s us define whether to calculate the difference on rows (axis=0) or on columns (axis=1)
Now that you have a strong understanding of how the Pandas diff method looks, let’s load a sample dataframe to follow along with.
Loading a Sample Pandas Dataframe
In order to follow along with this tutorial, feel free to load the dataframe below by copying and pasting the code into your favourite code editor. Of course, feel free to use your own data, though your results will, of course, vary.
# Loading a Sample Pandas Dataframe
import pandas as pd

df = pd.DataFrame.from_dict({
    'Date': pd.date_range('2022-01-01', '2022-01-11'),
    'Sales': [198, 123, 973, 761, 283, 839, 217, 666, 601, 992, 205]
})

print(df.head())

# Returns:
#         Date  Sales
# 0 2022-01-01    198
# 1 2022-01-02    123
# 2 2022-01-03    973
# 3 2022-01-04    761
# 4 2022-01-05    283
We can see that we have a dataframe with two columns: one containing dates and another containing sales values. We were able to generate our dates column using the Pandas date_range function, which I cover off extension in this tutorial.
In the next section, you’ll learn how to calculate the difference between Pandas Dataframe rows.
Calculating the Difference Between Pandas Dataframe Rows
The Pandas diff method allows us to easily subtract two rows in a Pandas Dataframe. By default, Pandas will calculate the difference between subsequent rows. Let’s see how we can use the method to calculate the difference between rows of the Sales column:
# Calculating the difference between two rows
df['Sales'] = df['Sales'].diff()

print(df.head())

# Returns:
#         Date  Sales
# 0 2022-01-01    NaN
# 1 2022-01-02  -75.0
# 2 2022-01-03  850.0
# 3 2022-01-04 -212.0
# 4 2022-01-05 -478.0
We can see here that Pandas has done a few things here:
- It has calculated the difference between our two rows. This is done by subtracting the lower row by the upper row.
- We can also see that it has left a single
NaNvalue in the Sales column. This is because the first value has nothing to be subtracted by. The number ofNaNvalues is always equal to the number of periods we’re calculating.
Something you may want to do is be able to assign this difference to a new column. This is what you’ll learn in the next section.
Assign the Difference Between Pandas Dataframe Rows to a New Column
In many cases, you will not want to lose your original data. Because of this, it can be quite helpful to assign the differences between rows to a new dataframe column. We can do this by directly assigning the difference to a new column. Let’s take a look at what this looks like:
# Assigning the difference between rows to a new column
df['Sales Difference'] = df['Sales'].diff()

print(df.head())

# Returns:
#         Date  Sales  Sales Difference
# 0 2022-01-01    198               NaN
# 1 2022-01-02    123             -75.0
# 2 2022-01-03    973             850.0
# 3 2022-01-04    761            -212.0
# 4 2022-01-05    283            -478.0
By doing this, we’re able to retain the original data but also gain further insight into our data by displaying the differences.
Calculating the Difference Between Pandas Rows at Different Intervals
You may not always want to calculate the difference between subsequent rows. Following our example, you may want to know what the sales were like a week ago, compared to any given day’s sales. We accomplish this by changing the periods= parameter to whichever periodicity that we want.
Let’s see how we can calculate the difference between a periodicity of seven days:
# Changing the difference in periodicity between row differences
df['Sales Difference'] = df['Sales'].diff(periods=7)

print(df.head(10))

# Returns:
#         Date  Sales  Sales Difference
# 0 2022-01-01    198               NaN
# 1 2022-01-02    123               NaN
# 2 2022-01-03    973               NaN
# 3 2022-01-04    761               NaN
# 4 2022-01-05    283               NaN
# 5 2022-01-06    839               NaN
# 6 2022-01-07    217               NaN
# 7 2022-01-08    666             468.0
# 8 2022-01-09    601             478.0
# 9 2022-01-10    992              19.0
We can now that we’re calculating the difference between row 8 and row 1, row 9 and row 2, etc. Because of this, the first seven rows will show a NaN value.
In the next section, you’ll learn how to use the axis= parameter to subtract columns.
Calculating the Difference Between Pandas Columns
Pandas offers a number of different ways to subtract columns. One of these ways is the Pandas diff method. That being said, it’s a bit of an unusual approach and may not be the most intuitive. I’m covering it off here for completeness, though I’ll offer a preferred approach after.
In order to make this make more logical sense, let’s add a different column to our dataframe:
# Loading a Sample Pandas Dataframe
import pandas as pd

df = pd.DataFrame.from_dict({
    'Sales January': [198, 123, 973, 761, 283, 839, 217, 666, 601, 992, 205],
    'Sales February': [951, 556, 171, 113, 797, 720, 570, 724, 153, 277, 932]
})

df = df.diff(axis=1)

print(df.head())

# Returns:
#    Sales January  Sales February
# 0            NaN             753
# 1            NaN             433
# 2            NaN            -802
# 3            NaN            -648
# 4            NaN             514
There are a number of nuances with this approach:
- You can’t combine data types
- You end up with a useless column containing only
NaNvalues
Instead of this approach, it may be more prudent simply to subtract the columns directly:
# Calculating the difference between columns
import pandas as pd

df = pd.DataFrame.from_dict({
    'Date': pd.date_range('2022-01-01', '2022-01-11'),
    'Sales January': [198, 123, 973, 761, 283, 839, 217, 666, 601, 992, 205],
    'Sales February': [951, 556, 171, 113, 797, 720, 570, 724, 153, 277, 932]
})

df['Sales Difference'] = df['Sales February'] = df['Sales January']

print(df.head())

# Returns:
#         Date  Sales January  Sales February  Sales Difference
# 0 2022-01-01            198             198               198
# 1 2022-01-02            123             123               123
# 2 2022-01-03            973             973               973
# 3 2022-01-04            761             761               761
# 4 2022-01-05            283             283               283
This approach is a much more intuitive and readable approach to calculating the difference between Pandas columns.
Differences Between Pandas Diff and Pandas Shift
Pandas offers a number of functions related to adjusting rows and enabling you to calculate the difference between them. For example, the Pandas shift method allows us to shift a dataframe in different directions, for example up and down. Because of this, we can easily use the shift method to subtract between rows.
The Pandas shift method offers a pre-step to calculating the difference between two rows by letting you see the data directly. The Pandas diff method simply calculates the difference, thereby abstracting the calculation. Use diff when you only care about the difference, and use shift when you care about retaining the values, such as when you want to calculate the percentage change between rows.
Plotting Daily Differences in Pandas and Matplotlib
In this final section, you’ll learn how to easily plot the differences between consecutive rows in a Pandas Dataframe. For this, let’s load a weather forecast dataframe to show weather fluctuates between seven day periods.
For this, we’ll import matplotlib.pyplot as plt, which allows us to visualize the data. We’ll also load data from the NOAA website with some sample data.
Let’s see how this works:
# Visualizing Daily Differences Using Matplotlib
import pandas as pd
import matplotlib.pyplot as plt
df = pd.read_csv('https://www1.ncdc.noaa.gov/pub/data/cdo/samples/NORMAL_DLY_sample_csv.csv', usecols=['DATE', 'DLY-TMAX-NORMAL'], parse_dates=['DATE'])

df['Temp Difference'] = df['DLY-TMAX-NORMAL'].diff(periods=7)

df.plot(x='DATE', y='Temp Difference', kind='line')
plt.show()
This returns the following plot:

We can see here that our temperatures fluctuate in seasonal patterns, making this a very useful visualization.
Conclusion
In this tutorial, you learned how to calculate the difference between Pandas dataframe rows using the Pandas diff method. You learned how to change the periodicity in your calculation and how to assign values to new a column. Finally, you learned how to calculate the difference between Pandas columns, as well as a more intuitive method for doing this. Finally, you learned how to use Pandas and matplotlib to visualize the periodic differences.
To learn more about the Pandas diff method, check out the official documentation here.
Related Articles
Check out the following related articles to learn more: