
The Pandas groupby method is a powerful tool that allows you to aggregate data using a simple syntax, while abstracting away complex calculations. One of the strongest benefits of the groupby method is the ability to group by multiple columns, and even apply multiple transformations.
By the end of this tutorial, you’ll have learned the following:
- How to use the Pandas groupby method with multiple columns by walking through the syntax and practical examples
- How to use multiple aggregations for multiple columns, allowing you to calculate summary statistics for multiple columns
- How to specify what aggregations to use for different columns using Pandas groupby
- How to customize the behaviour of Pandas groupby by renaming columns, handling missing values, and using custom functions
The Quick Answer: How to Use the Pandas GroupBy Method with Multiple Columns
To use Pandas groupby with multiple columns, you can pass in a list of column headers directly into the method. The order in which you pass columns into the list determines the hierarchy of columns you use.
Table of Contents
Loading a Sample Pandas DataFrame
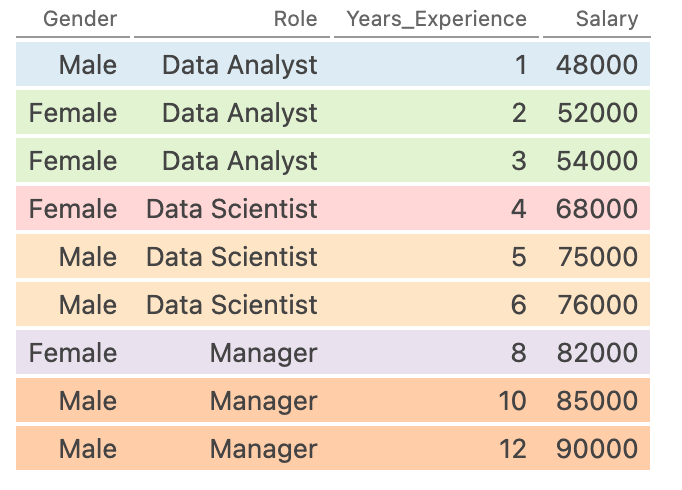
For this tutorial, we’ll use a simple Pandas DataFrame that allows us to easily follow how grouping by multiple columns works using Pandas groupby:
# Loading a Sample Pandas DataFrame
import pandas as pd
data = {
'Gender': ['Male', 'Female', 'Female', 'Female', 'Male', 'Male', 'Female', 'Male', 'Male'],
'Role': ['Data Analyst', 'Data Analyst', 'Data Analyst', 'Data Scientist', 'Data Scientist', 'Data Scientist', 'Manager', 'Manager', 'Manager'],
'Years_Experience': [1, 2, 3, 4, 5, 6, 8, 10, 12],
'Salary': [48000, 52000, 54000, 68000, 75000, 76000, 82000, 85000, 90000]}
df = pd.DataFrame(data)
print(df)
By printing this DataFrame, we return the following table:
| Gender | Role | Years_Experience | Salary |
|---|---|---|---|
| Male | Data Analyst | 1 | 48000 |
| Female | Data Analyst | 2 | 52000 |
| Female | Data Analyst | 3 | 54000 |
| Female | Data Scientist | 4 | 68000 |
| Male | Data Scientist | 5 | 75000 |
| Male | Data Scientist | 6 | 76000 |
| Female | Manager | 8 | 82000 |
| Male | Manager | 10 | 85000 |
| Male | Manager | 12 | 90000 |
We can see that in our DataFrame that we have four columns:
- The Gender of our employee
- The Role of our employee
- The Years of Experience, showing how long employees have been working
- The Salary, showing how much each employee is making
Let’s now dive into how we can use the Pandas groupby method to aggregate data by multiple columns.
How to Use Pandas groupby With Multiple Columns
In order to use the Pandas groupby method with multiple columns, you can pass a list of columns into the function. This allows you to specify the order in which want to group data.
Let’s take a look at how this works in Pandas:
# Grouping a DataFrame by Multiple Columns
df.groupby(['Role', 'Gender'])
In the code block above, we specified that we wanted to group our data first by Role and then by Gender. Let’s take a look at what’s happening under the hood by visualizing how this transforms our data:
We can see that each color represents a different grouping. In fact, we have a grouping for each Role and Gender combination. The benefit of this is that we can now aggregate data by these groupings.
Let’s now take a look at how we can aggregate data with these groupings. To keep things simple, let’s calculate the sum of each group for the Salary column:
# Calculate the Sum for Each Group
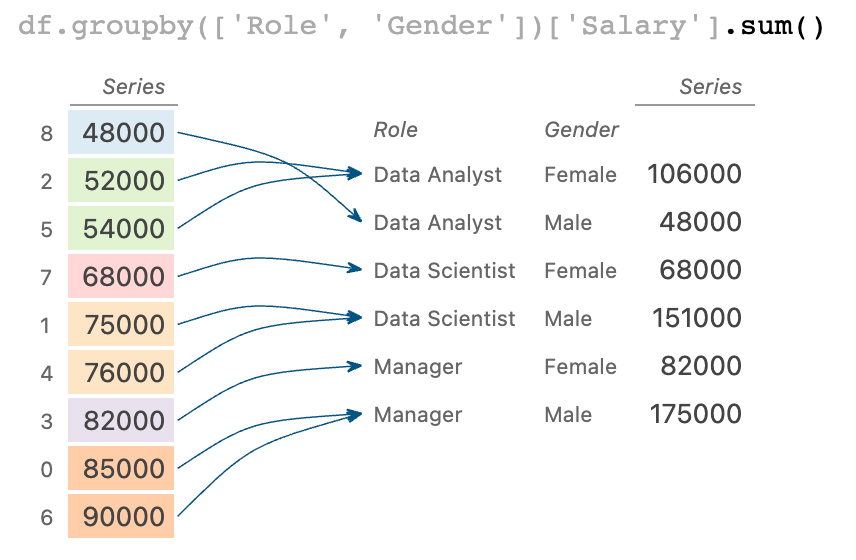
df.groupby(['Role', 'Gender'])['Salary'].sum()Let’s take a look at what is happening under the hood in how the data are calculated:
We can see what this data looks like by printing it out:
# Calculate the Sum for Each Group
print(df.groupby(['Role', 'Gender'])['Salary'].sum())

# Returns:
# Role            Gender
# Data Analyst    Female    106000
#                 Male       48000
# Data Scientist  Female     68000
#                 Male      151000
# Manager         Female     82000
#                 Male      175000
# Name: Salary, dtype: int64
We can see that we end up with a Pandas Series that has multiple indices – one for each grouping. We can now better understand the total salaries broken out by role and by gender.
Using Pandas GroupBy With Multiple Columns and Multiple Aggregation Methods
Building on what you learned in the previous section, we can also apply multiple aggregations to a single column when using the Pandas groupby method with multiple columns. This allows you to analyze data easily across different statistics.
In order to do this, we use the Pandas aggregate method, which allows you to customize how data are aggregated. The Pandas aggregate method allows you to apply one or more aggregation functions to specific columns of a DataFrame, providing summary statistics or custom computations for those columns.
Let’s take a look at how we can calculate three different statistics for our grouping:
- The count will give us an understanding of how many staff fall into each group
- The sum will give us a sense of the total salaries for this group
- The mean will give us a sense of the average salaries for each group
Let’s see how we can use the Pandas .agg() method to calculate multiple aggregations for a Pandas groupby object:
# Aggregate Data in Multiple Ways Using Pandas GroupBy
multiple_aggregations = df.groupby(['Role', 'Gender'])['Salary'].agg(['count', 'sum', 'mean'])
print(multiple_aggregations)

# Returns:
#                        count     sum     mean
# Role           Gender
# Data Analyst   Female      2  106000  53000.0
#                Male        1   48000  48000.0
# Data Scientist Female      1   68000  68000.0
#                Male        2  151000  75500.0
# Manager        Female      1   82000  82000.0
#                Male        2  175000  87500.0
Similar to our previous example, we can see that the groupings stay the same, but that we were able to use different aggregation methods. Let’s see how this operates visually:
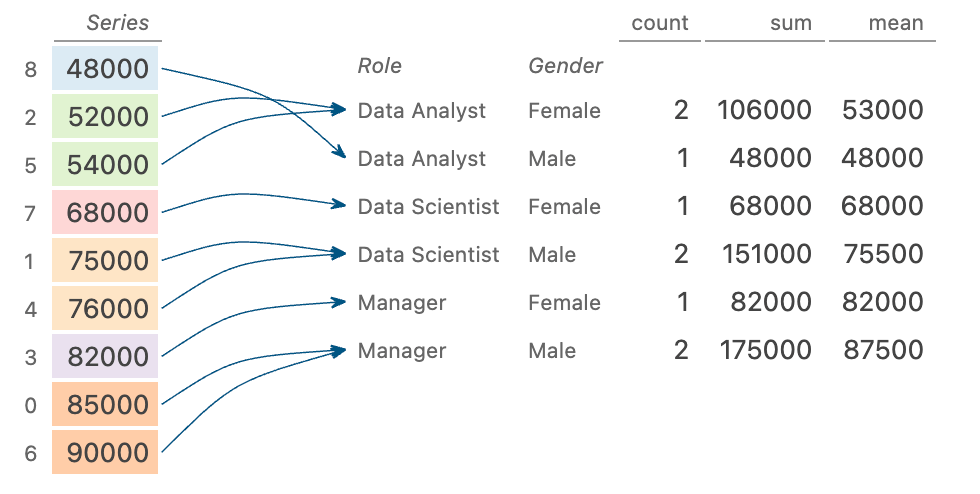
We can see that this works similarly to our previous example. The big difference is that rather than returning a Pandas Series, we actually return a Pandas DataFrame. This allows us to easily apply different pieces of our broader Pandas toolkit, like filtering our DataFrame.
In the following section, you’ll learn how to use different aggregations for different columns in Pandas groupby.
Using Different Aggregations When Grouping By Multiple Columns in Pandas
The strength of combining the Pandas .groupby() method and the .aggregate() method is that you can use different aggregations for different columns. In order to do this, we need to modify how we use the aggregate() method. Let’s take a look at this first and see how our code changes:
# How to Use Different Aggregations for Different Columns
df.groupby(['Grouping Column 1', 'Grouping Column 2']).agg({
    'Aggregation Column 1': ['Aggregation Method 1', 'Aggregation Method 2'],
    'Aggregation Column 2': 'Aggregation Method 3'})
Oof! There’s quite a bit going on in the code block above. But it’s actually quite simple:
- We group our data in the same way as before. However, we don’t index a column immediately. Instead, we apply the
.agg()method directly to the groupby object. - We pass a dictionary into the method. The keys for this dictionary are the columns we want to aggregate, while the values are either strings or lists of strings of the aggregations we want to use.
Let’s take a look at how we can use what you just learned and aggregate multiple columns using Pandas:
# Using Different Aggregations in GroupBy
different_aggregations = df.groupby(['Role', 'Gender']).agg({
    'Years_Experience': 'max',
    'Salary': ['mean', 'median']
})
print(different_aggregations)

# Returns:
#                       Years_Experience   Salary
#                                    max     mean   median
# Role           Gender
# Data Analyst   Female                3  53000.0  53000.0
#                Male                  1  48000.0  48000.0
# Data Scientist Female                4  68000.0  68000.0
#                Male                  6  75500.0  75500.0
# Manager        Female                8  82000.0  82000.0
#                Male                 12  87500.0  87500.0
In the code block above, we applied a few aggregations to our data:
- We calculated the maximum value of the
Years_Experiencecolumn - We also calculated the mean and median for the
Salarycolumn
Let’s take a look again at how this works under the hood:
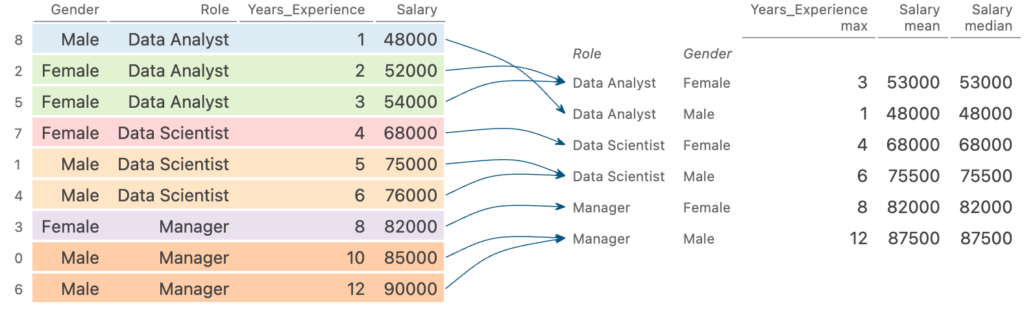
We can see that this works in the same way as our earlier example, by returning a DataFrame. The main difference is that not only do we have a multi-index column DataFrame, but also a multi-index row DataFrame.
Conclusion
In this tutorial, you learned how to use Pandas groupby with multiple columns. The groupby method is an incredibly powerful and versatile method that allows you to aggregate values in a similar way to SQL GROUP BY statements.
You first learned how to use the .groupby() method with multiple columns. Then, you learned how to aggregate only a single column, when grouping by multiple columns. Then, you learned how to specify multiple aggregations for a single column. Finally, you learned how to specify different aggregations for each column when grouping by multiple columns.
Additional Resources
To learn more about related topics, check out the tutorials below: