In this tutorial, you’ll learn how to use the Pandas describe method, which is used to computer summary descriptive statistics for your Pandas Dataframe. By the end of reading this tutorial, you’ll have learned how to use the Pandas .describe() method to generate summary statistics and how to modify it using its different parameters, to make sure you get the results you’re hoping for.
Being able to understand your data using high-level summary statistics is an important first step in your exploratory data analysis (EDA). It’s a helpful first step in your data science work, that opens up your work to statistics you may want to explore further.
The Pandas .describe() method provides you with generalized descriptive statistics that summarize the central tendency of your data, the dispersion, and the shape of the dataset’s distribution. It also provides helpful information on missing NaN data.
The Quick Answer: Pandas describe Provides Helpful Summary Statistics
.describe() method for summary statisticsTable of Contents
Loading a Sample Pandas Dataframe
If you want to follow along with the tutorial on the Pandas describe method, feel free to copy the code below. The code will generate a dataframe based on the Seaborn library (which I cover off in great detail here). The library provides a number of datasets to guide you through different scenarios. These datasets are accessible via the load_dataset() function.
If you don’t have Seaborn installed, you can install it using either pip or conda. To install it with pip, simply write pip install seaborn into your terminal.
Let’s load a sample dataframe to follow along with:
# Loading a sample Pandas dataframe
from seaborn import load_dataset

df = load_dataset('penguins')
print(df.head())

# Returns:
  species     island  bill_length_mm  bill_depth_mm  flipper_length_mm  body_mass_g     sex
0  Adelie  Torgersen            39.1           18.7              181.0       3750.0    Male
1  Adelie  Torgersen            39.5           17.4              186.0       3800.0  Female
2  Adelie  Torgersen            40.3           18.0              195.0       3250.0  Female
3  Adelie  Torgersen             NaN            NaN                NaN          NaN     NaN
4  Adelie  Torgersen            36.7           19.3              193.0       3450.0  Female
We can see, that by printing out the first five records of our dataframe using the Pandas .head() method, that our dataframe has seven columns. Some of these columns are numeric, while others contain string values. However, beyond that, we can’t see much else about the data in the dataframe, such as the distribution of the data itself.
This is where the Pandas describe method comes into play! In the next section, you’ll learn how to generate some summary statistics using the Pandas describe method.
Understanding the Pandas describe Method
The Pandas describe method is a helpful dataframe method that returns descriptive and summary statistics. The method will return items such:
- The number of items
- Measures of dispersion
- Measures of central tendency
- Percentiles of data
- Maximum and minumum values
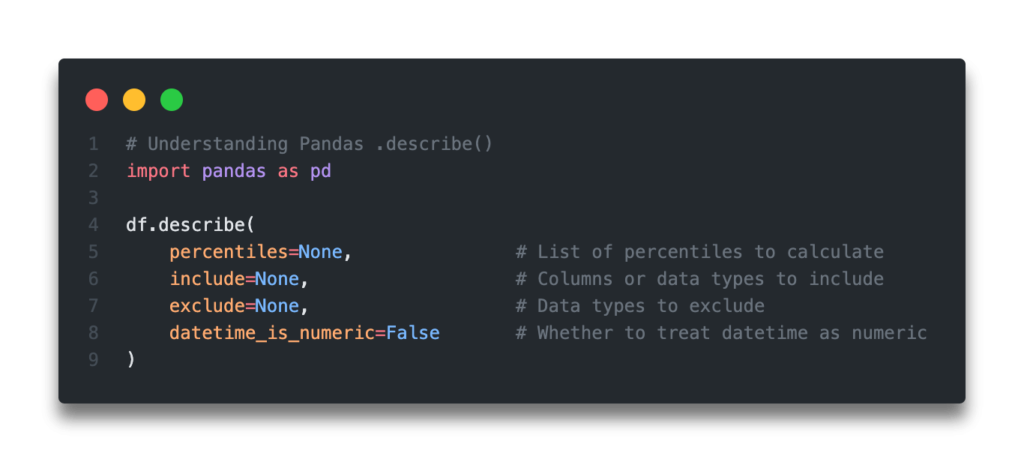
Let’s break down the various arguments available in the Pandas .describe() method:
| Parameter | Default Value | Description |
|---|---|---|
percentiles= | [.25, .5, .75] | The percentiles to include in the output. The values should fall between the values of 0 and 1. The values should be formatted in a list-like array of numbers. |
include= | None | A white list of the data types to include in the result. Accepts: – ‘all’: include all colums – a list-like array of datatypes to include – None: include all numeric columns |
exclude= | None | A black list of of data types to omit from the result. Accept: – a list-like array of datatypes to exclude – None: include all numeric columns |
datetime_is_numeric= | False | Whether to treat datetime as numeric, which affects the statistics calculated for the column. (New in v1.1.0) |
.describe() methodLet’s see what happens when we apply the method with default parameters:
# Running the Pandas dataframe .describe() method with default parameters
from seaborn import load_dataset

df = load_dataset('penguins')
print(df.describe())

# Returns
#        bill_length_mm  bill_depth_mm  flipper_length_mm  body_mass_g
# count      342.000000     342.000000         342.000000   342.000000
# mean        43.921930      17.151170         200.915205  4201.754386
# std          5.459584       1.974793          14.061714   801.954536
# min         32.100000      13.100000         172.000000  2700.000000
# 25%         39.225000      15.600000         190.000000  3550.000000
# 50%         44.450000      17.300000         197.000000  4050.000000
# 75%         48.500000      18.700000         213.000000  4750.000000
# max         59.600000      21.500000         231.000000  6300.000000
We can that for numeric columns, the dataframe returns the key summary statistics described above.
Similarly, if you only wanted to describe a single column, then you could apply the .describe() method to a Pandas series (or column). Let’s see what this looks like:
print(df['body_mass_g'].describe())

# Returns:
# count     342.000000
# mean     4201.754386
# std       801.954536
# min      2700.000000
# 25%      3550.000000
# 50%      4050.000000
# 75%      4750.000000
# max      6300.000000
# Name: body_mass_g, dtype: float64
In the next section, you’ll learn how to change the percentiles of the data returned, using the percentiles= parameter.
Specifying Percentiles in Pandas Describe
The percentile in descriptive statistics is used to identify how many of the values in the series are less than the given percentile. If we, for example, identify a value for the 75th percentile, we indicate that 75% of the values are below that value.
By default, Pandas assigns the percentiles of [.25, .5, .75] meaning that we get values for the 25th, 50th, and 75th percentiles.
We can pass in any array of numbers, as long as the values are all between 0 and 1. Let’s see how we can change this to identify percentiles, namely 10%, 50% and 90%:
print(df.describe(percentiles=[.1, .5, .9]))

# Returns
#        bill_length_mm  bill_depth_mm  flipper_length_mm  body_mass_g
# count      342.000000     342.000000         342.000000   342.000000
# mean        43.921930      17.151170         200.915205  4201.754386
# std          5.459584       1.974793          14.061714   801.954536
# min         32.100000      13.100000         172.000000  2700.000000
# 10%         36.600000      14.300000         185.000000  3300.000000
# 50%         44.450000      17.300000         197.000000  4050.000000
# 90%         50.800000      19.500000         220.900000  5400.000000
# max         59.600000      21.500000         231.000000  6300.000000
We can see by specifying the percentiles, we’re able to modify which descriptive statistics are returned. This allows us to see different spreads of data across our dataframe.
In the next section, you’ll learn how to specify the data types of the columns you want to include.
Check out some other Python tutorials on datagy, including our complete guide to styling Pandas and our comprehensive overview of Pivot Tables in Pandas!
Specifying Dataframe Columns to Include with Pandas Describe
By default, the Pandas describe method will only include numeric columns. This, in part, is because only numeric values can be used to calculate a mean or percentiles. The argument allows us to pass in columns such as 'all', which will include all columns. It also allows us to pass in a list of different data types to include. This can be helpful, for example, when you have coded numerical columns and don’t want to include them.
Let’s see how we can change the methods behaviour to include all columns:
print(df.describe(include='all'))

# Returns
#        species  island  bill_length_mm  bill_depth_mm  flipper_length_mm  body_mass_g   sex
# count      344     344      342.000000     342.000000         342.000000   342.000000   333
# unique       3       3             NaN            NaN                NaN          NaN     2
# top     Adelie  Biscoe             NaN            NaN                NaN          NaN  Male
# freq       152     168             NaN            NaN                NaN          NaN   168
# mean       NaN     NaN       43.921930      17.151170         200.915205  4201.754386   NaN
# std        NaN     NaN        5.459584       1.974793          14.061714   801.954536   NaN
# min        NaN     NaN       32.100000      13.100000         172.000000  2700.000000   NaN
# 25%        NaN     NaN       39.225000      15.600000         190.000000  3550.000000   NaN
# 50%        NaN     NaN       44.450000      17.300000         197.000000  4050.000000   NaN
# 75%        NaN     NaN       48.500000      18.700000         213.000000  4750.000000   NaN
# max        NaN     NaN       59.600000      21.500000         231.000000  6300.000000   NaN
We can see now that all columns are included in the describe method’s output. We can see that this actually this includes different metrics, such as unique and top.
Treat DateTime Columns as Numeric in Pandas Describe
In Pandas version 1.1, a new argument was introduced. This argument, datetime_isnumeric=, allows us to treat datetime values as numeric, rather than as string values.
Let’s load a different dataframe so that we can see how this argument works. We’ll leave the value set to the default and then toggle it to True and see how it changes.
import pandas as pd

df = pd.DataFrame.from_dict({
    'Date': ['2021-12-01', '2021-12-02', '2021-12-03', '2021-12-04', '2021-12-05'],
    'Values': [100, 120, 140, 160, 180]
})

print(df.describe())

# Returns:
#            Values
# count    5.000000
# mean   140.000000
# std     31.622777
# min    100.000000
# 25%    120.000000
# 50%    140.000000
# 75%    160.000000
# max    180.000000
By default, the Date column is not included. Let’s not change the datetime_isnumeric= argument to True and see how this changes the output:
print(df['Date'].describe(datetime_is_numeric=True))

# Returns:
# count              5
# unique             5
# top       2021-12-01
# freq               1
# Name: Date, dtype: object
We can see that when datetime values are treated as numeric we are able to get some key statistics about them, including the count, number of unique items, and the frequency of the top values.
Conclusion
In this tutorial, you learned how to use the Pandas .describe() method, which is a helpful method to generate summary, descriptive statistics on your dataframe. You learned how to use the describe method to specify particular percentiles and how to include or exclude columns based on datatypes.
To learn more about the Pandas describe method, check out the official documentation here.
Pingback: Pandas Quantile: Calculate Percentiles of a Dataframe • datagy
Pingback: Calculate the Pearson Correlation Coefficient in Python • datagy
Pingback: Summarizing and Analyzing a Pandas DataFrame • datagy