You may find yourself in a position where you need to use Python to extract tables from a webpage to gather data, and you’ll be thinking of using Python. Perhaps you’ve heard of libraries like Beautiful Soup. But with data that’s structured in tables, you can use Pandas to easily get web data for you as well! We’ll use this post to explore how to scrape web tables easily with Python and turn them into functional dataframes!
How To Scrape Web Tables with Python
In order to easily extract tables from a webpage with Python, we’ll need to use Pandas. If you haven’t already done so, install Pandas with either pip or conda.
pip install pandas #or
conda install pandas
From there, we can import the library using:
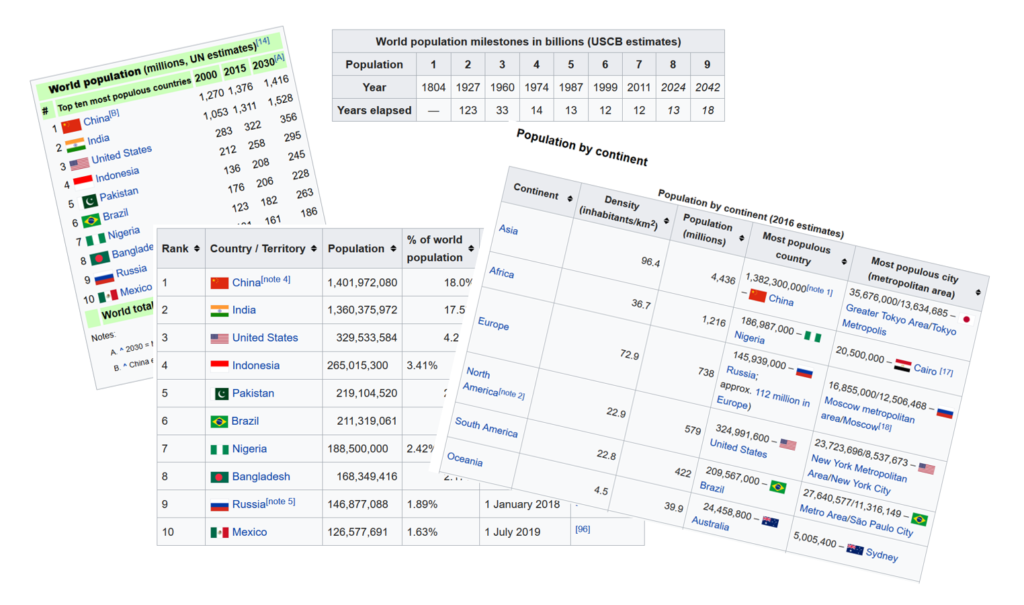
import pandas as pdFor this example, we’ll want to scrape the data tables available on the World Population Wikipedia article. There are plenty of tables available on the page. Here we show just a few, but take a moment to explore the different tables that are available:

In other posts, like this one on un-pivoting data, we explored how to load data into a Pandas dataframe. We’ll take a slightly different approach this time and use the pd.read_html function:
dfs = pd.read_html('http://en.wikipedia.org/wiki/World_population')You may notice two things here:
- We named our variable dfs, as this function generates a list of all the dataframes it pulls, and
- We removed the s from https, as the function runs better on http.
It may not be immediately intuitive to find the order in which tables appear, but they are read in the order in which they appear in the HTML code of the site. This can be accessed by right-clicking and selecting View Page Source (this may vary depending on browser and operating system):

We can also explore the different dataframes directly in Python, in the same way that we would access a list item. If we wanted to print out the third dataframe, we could write:
print(dfs[2])

# Returns:
# Continent Density(inhabitants/km2)  ...                              Most populous country             Most populous city (metropolitan area)
# 0                   Asia                     96.4  ...                      1,382,300,000[note 1] – China  35,676,000/13,634,685 – Greater Tokyo Area/Tok...
# 1                 Africa                     36.7  ...                             0186,987,000 – Nigeria                            20,500,000 – Cairo [17]
# 2                 Europe                     72.9  ...  0145,939,000 – Russia;approx. 112 million in E...  16,855,000/12,506,468 – Moscow metropolitan ar...
# 3  North America[note 2]                     22.9  ...                       0324,991,600 – United States  23,723,696/8,537,673 – New York Metropolitan A...
# 4          South America                     22.8  ...                              0209,567,000 – Brazil  27,640,577/11,316,149 – Metro Area/São Paulo City
# 5                Oceania                      4.5  ...                           0024,458,800 – Australia                                 5,005,400 – Sydney
# 6             Antarctica           0.0003(varies)  ...                                        N/A[note 3]    1,200 (non-permanent, varies) – McMurdo Station
[7 rows x 5 columns]
If we now wanted to assign this table to a dataframe, we can give it a meaningful name by writing:
pop_by_continent = dfs[3]We can then write helpful Pandas commands such as the .head() function or the describe function.
Conclusion: Use Python to Extract Tables from Webpages
In this post, we explored how to easily scrape web tables with Python, using the always-powerful Pandas. To learn more about the function available in Pandas, check out its official documentation.
Additional Resources
To learn more about related topics, check out the tutorials below:

