In this tutorial, you’ll learn how to bin data in Python with the Pandas cut and qcut functions. You’ll learn why binning is a useful skill in Pandas and how you can use it to better group and distill information. By the end of this tutorial, you’ll have learned:
- How to use the
cutandqcutfunctions in Pandas - When to use which function
- How to modify the behavior of these functions to customize the bins that are created
Table of Contents
What is Binning in Pandas and Python?
In many cases when dealing with continuous numeric data (such as ages, sales, or incomes), it can be helpful to create bins of your data. Binning data will convert data into discrete buckets, allowing you to gain insight into your data in logical ways. Binning data is also often referred to under several other terms, such as discrete binning, quantization, and discretization.
In this tutorial, you’ll learn about two different Pandas methods, .cut() and .qcut() for binning your data. These methods will allow you to bin data into custom-sized bins and equally-sized bins, respectively. Equal-sized bins allow you to gain easy insight into the distribution, while grouping data into custom bins can allow you to gain insight into logical categorical groupings.
Loading a Sample Pandas DataFrame
To follow along with the tutorial, let’s use a very simple Pandas DataFrame. The data is deliberately kept simple to better understand how the data is being split. The dataset has only two columns: a Name column and an Age column. Let’s load the data using the .from_dict() method:
# Loading a Sample Pandas DataFrame
import pandas as pd

df = pd.DataFrame.from_dict({
    'Name': ['Ray', 'Jane', 'Kate', 'Nik', 'Autumn', 'Kasi', 'Mandeep', 'Evan', 'Kyra', 'Jim'],
    'Age': [12, 7, 33, 34, 45, 65, 77, 11, 32, 55]
})

print(df.head())

# Returns:
#      Name  Age
# 0     Ray   12
# 1    Jane    7
# 2    Kate   33
# 3     Nik   34
# 4  Autumn   45
In the next section, you’ll learn how to use the Pandas .qcut() method to bin data into equal-sized bins.
Pandas qcut: Binning Data into Equal-Sized Bins
The Pandas .qcut() method splits your data into equal-sized buckets, based on rank or some sample quantiles. This process is known as quantile-based discretization. Let’s take a look at the parameters available in the function:
# Parameters of the Pandas .qcut() method
pd.qcut(
    x,                      # Column to bin
    q,                      # Number of quantiles
    labels=None,            # List of labels to include
    retbins=False,          # Whether to return the bins/labels or not
    precision=3,            # The precision to store and display the bins labels
    duplicates='raise'      # If bin edges are not unique, raise a ValueError
)
The function only has two required parameters, the column to bin (x=) and the number of quantiles to generate (q=). The function returns a Series of data that can, for example, be assigned to a new column. Let’s see how we can split our Age column into four different quantiles:
# Splitting Age Column into Four Quantiles
df['Age Groups'] = pd.qcut(df['Age'], 4)
print(df.head())

# Returns:
#      Name  Age     Age Groups
# 0     Ray   12  (6.999, 17.0]
# 1    Jane    7  (6.999, 17.0]
# 2    Kate   33   (17.0, 33.5]
# 3     Nik   34   (33.5, 52.5]
# 4  Autumn   45   (33.5, 52.5]
At first glance, this new Age Groups column may look a little strange. Let’s take a moment to explore it a bit. First, we’ll take a look at the data type of the column, using the .dtype attribute.
# Checking the data type of the qcut column
df['Age Groups'] = pd.qcut(df['Age'], 4)
print(df['Age Groups'].dtype)

# Returns: category
The data type that gets returned is category, which is an incredibly memory-efficient way for Pandas to store categorical data. Let’s take a look at what the actual labels in the column mean:
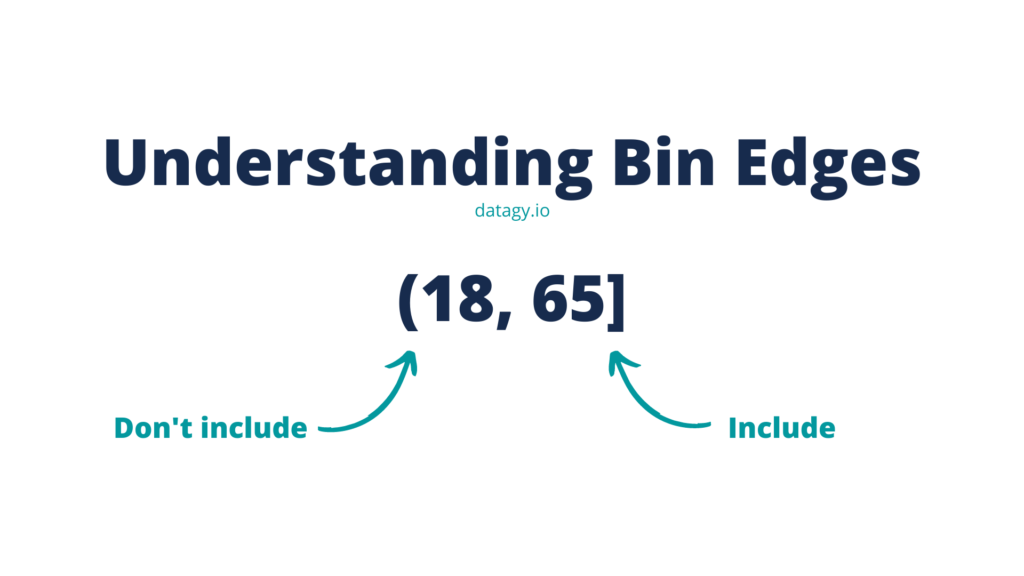
The image above shows that a square bracket, [ or ], indicates that that data point is included in the range. A regular parenthesis such as ( or ) indicates that the edge is not included in the group.
Splitting Data Into Equal Percentiles Using Pandas qcut
Rather than simply passing in a number of groupings you want to create, you can also pass in a list of quartiles you want to create. This list should be a range from 0 through 1, splitting the data into equal percentages. Let’ see how we can split our data into 25% bins.
# Splitting Age Column into Four Quantiles
df['Age Groups'] = pd.qcut(
   df['Age'],
   [0, 0.25, 0.5, 0.75, 1]
)
print(df.head())

# Returns:
#      Name  Age     Age Groups
# 0     Ray   12  (6.999, 17.0]
# 1    Jane    7  (6.999, 17.0]
# 2    Kate   33   (17.0, 33.5]
# 3     Nik   34   (33.5, 52.5]
# 4  Autumn   45   (33.5, 52.5]
You can see here that this returned the same result as we had before. Our data is split into four equal-sized buckets based on the ranges of the data.
Adding Labels to Bins in Pandas with qcut
Right now, the bins of our dataset are descriptive, but they’re also a little hard to read. You can pass in a list of labels that you want to relabel your dataset as. The length of the list should match the number of bins being created. Let’s see how we can convert our grouped data into descriptive labels:
# Adding Labels to Pandas .qcut()
df['Age Groups'] = pd.qcut(
   df['Age'],
   [0, 0.25, 0.5, 0.75, 1],
   labels=['0-25%', '26-49%', '51-75%', '76-100%']
)
print(df.head())

# Returns:
#      Name  Age Age Groups
# 0     Ray   12      0-25%
# 1    Jane    7      0-25%
# 2    Kate   33     26-49%
# 3     Nik   34     51-75%
# 4  Autumn   45     51-75%
This makes our Pandas binning process much easier to understand!
Modifying Bin Precision in Pandas with qcut
Let’s go back to our earlier example, where we simply passed in q=4 to split the data into four quantiles. The bins returned with a high degree of precision and looked like this: (6.999, 17.0]. By default, Pandas will use a precision=3 argument, which results in three precision points to store and display the bins.
While this is more precise and accurate, it often doesn’t look very nice. Let’s try changing the precision to be 1 and see what our categories look like now:
# Modifying Precision in Categories
df['Age Groups'] = pd.qcut(
   df['Age'],
   4,
   precision=1
)
print(df.head())

# Returns:
#      Name  Age    Age Groups
# 0     Ray   12   (6.9, 17.0]
# 1    Jane    7   (6.9, 17.0]
# 2    Kate   33  (17.0, 33.5]
# 3     Nik   34  (33.5, 52.5]
# 4  Autumn   45  (33.5, 52.5]
This is much easier to read and understand how the categories work, though you do lose some precision.
In the following section, you’ll learn how to use the Pandas cut method to define custom bins of data.
Pandas cut: Binning Data into Custom Bins
The Pandas cut function is closely related to the .qcut() function. However, it’s used to bin values into discrete intervals, which you define yourself. This, for example, can be very helpful when defining meaningful age groups or income groups. In many cases, these groupings will have some other type of meaning, such as legal or cultural.
The Pandas .cut() function can, technically, accomplish the same results as the .qcut() function, but it also provides significantly more control over the results. Let’s take a look at the functions parameters:
# Parameters of the .cut() Function
pd.cut(
    x,                          # The input array to be binned
    bins,                       # The bins to use: int (# of bins) or sequence (widths)
    right=True,                 # Whether to include right-most edge
    labels=None,                # Labels to be used for bins
    retbins=False,              # Whether to return bins or not
    precision=3,                # Precision to store and display bins
    include_lowest=False,       # Whether first interval should be left inclusive or not
    duplicates='raise',         # What to do if bins edges are not unique
    ordered=True                # Whether labels are ordered or not
)
You can see that there is a good amount of overlap between the parameters available in the .qcut() and .cut() functions. However, the cut function also provides significantly more options. For example, as you’ll learn soon, you can define how Pandas handles the edges of its bins.
Let’s see how we can split the Age column into three different groups: under eighteen, between 19 and 65, and 65 and older.
df['Age Group'] = pd.cut(
   df['Age'],
   [0, 17, 64, 100]
)
print(df.head())

# Returns:
#      Name  Age Age Group
# 0     Ray   12   (0, 17]
# 1    Jane    7   (0, 17]
# 2    Kate   33  (17, 64]
# 3     Nik   34  (17, 64]
# 4  Autumn   45  (17, 64]
You can see that you’ve created three separate age groups here. As the brackets indicate, the values go from >0 to 17, >=18 to 64, >=65 to 100. In the next section, you’ll learn how to apply labels to these groupings.
Adding Labels to Bins in Pandas with cut
In this section, you’ll learn how to use the labels= parameter to pass in a list of labels. Similar to the qcut function, the labels need to be of the same length as the number of groupings.
Let’s pass in some string labels to make the groupings easier to read:
# Adding labels to the groupings
df['Age Group'] = pd.cut(
    df['Age'],
    [0, 17, 64, 100],
    labels=['0-18 years old', '18-65 years old', '65+ years old']
)
print(df.head())

# Returns:
#      Name  Age        Age Group
# 0     Ray   12   0-18 years old
# 1    Jane    7   0-18 years old
# 2    Kate   33  18-65 years old
# 3     Nik   34  18-65 years old
# 4  Autumn   45  18-65 years old
You can see that these results are much easier to read and interpret!
Modifying Edge Behaviour in Pandas cut
By default, Pandas will include the right-most edge of a group. Previously, when you defined the bins of [0, 17, 64, 100], this defined the following bins:
- >0 to 17
- >17 to 64
- >64 to 100
In our example, this is fine as we’re dealing with integer values. However, imagine that our ages were defined as floating-point values and we had an age of 17.5. In our example, since the age goes up to (and includes) 17, the value of 17.5 would be incorrectly included in our 18-64 age group.
We can use the right= parameter to modify this behavior. The argument defaults to True and identifies that the right-most value should be included. If we change this value to False, then the bin will include all values up to (but not including) that value.
Let’s recreate the same bins, but with a right exclusive range:
# Using the right= argument to modify binning behavior
df['Age Group'] = pd.cut(
    df['Age'],
    [0, 18, 65, 100],
    labels=['0-18 years old', '18-65 years old', '65+ years old'],
    right=False
)
print(df.head())

# Returns:
#      Name  Age        Age Group
# 0     Ray   12   0-18 years old
# 1    Jane    7   0-18 years old
# 2    Kate   33  18-65 years old
# 3     Nik   34  18-65 years old
# 4  Autumn   45  18-65 years old
Modifying First Interval Behaviour with Pandas cut
By default, Pandas will not include the left-most value in the bin. In the example above, if we’d included an age of 0, the value would not have been binned. If we wanted this value to be included, we could use the include_lowest= argument to modify the behavior.
By default, the argument will use a value of False. Modifying this to True will include that left-most value. Let’s see how to do this:
# Including left-most values
df['Age Group'] = pd.cut(
    df['Age'],
    [0, 18, 65, 100],
    labels=['0-18 years old', '18-65 years old', '65+ years old'],
    include_lowest=True
)
print(df.head())

# Returns:
#      Name  Age        Age Group
# 0     Ray   12   0-18 years old
# 1    Jane    7   0-18 years old
# 2    Kate   33  18-65 years old
# 3     Nik   34  18-65 years old
# 4  Autumn   45  18-65 years old
Creating Ordered Categories with Pandas cut
Beginning in Pandas version 1.1.0, the Pandas cut function will return an ordered categorical bin. This assigns an order to the values of that category. Let’s see what this behavior looks like when the default behavior is used.
# Creating Ordered Categories
print(pd.cut(
    df['Age'],
    [0, 18, 65, 100],
    labels=['0-18 years old', '18-65 years old', '65+ years old'],
    ordered=True
))

# Returns:
# 0     0-18 years old
# 1     0-18 years old
# 2    18-65 years old
# 3    18-65 years old
# 4    18-65 years old
# 5    18-65 years old
# 6      65+ years old
# 7     0-18 years old
# 8    18-65 years old
# 9    18-65 years old
# Name: Age, dtype: category
# Categories (3, object): ['0-18 years old' < '18-65 years old' < '65+ years old']
This allows you to sort categorical values, which are often represented by strings. This is a great benefit over using string values, since you’re able to sort values in a meaningful way.
Modifying the behavior to ordered=False removes this hierarchy, if it’s something that you don’t want to be created.
Exercises
It’s time to test your learning! Attempt to solve the exercises below. If you need help or want to double-check your solution, simply toggle the question.
Produce groupings covering 0-24.9%, 25-49.9%, 51-74.9%, and 100% of your data range. Keep the value of 0% included in the lowest range.
Since the .qcut() function doesn’t allow you to specify including the lowest value of the range, the cut() function needs to be used.
df['Age Group'] = pd.cut(
    df['Age'],
    [0, 0.25, 0.5, 0.75, 1],
    include_lowest=True,
    right=False
)
What is the benefit of ordering categories?
Because categories, though they look like strings, aren’t strings, their sorting might not work correctly. By including order in your categories, these values can be sorted appropriately.
When would you want to use the cut function over the qcut function?
The cut function allows you to define your own numeric ranges, while the qcut function enforces an equal distribution of the items in the bins.
Conclusion and Recap
In this tutorial, you learned how to bin your data in Python and Pandas using the cut and qcut functions. The section below provides a recap of what you learned:
- The Pandas
qcutfunction bins data into an equal distributon of items - The Pandas
cutfunction allows you to define your own ranges of data - Binning your data allows you to both get a better understanding of the distribution of your data as well as creating logical categories based on other abstractions
- Both functions gives you flexibility in defining and displaying your bins
Additional Resources
To learn about related topics, check out the tutorials below: