In this tutorial, you’ll learn what random forests in Scikit-Learn are and how they can be used to classify data. Decision trees can be incredibly helpful and intuitive ways to classify data. However, they can also be prone to overfitting, resulting in performance on new data. One easy way in which to reduce overfitting is to use a machine learning algorithm called random forests.
By the end of this tutorial, you’ll have learned:
- What random forest classifier algorithms are
- How to deal with missing and categorical data in Scikit-Learn
- How to create random forests in Scikit-Learn
- How to visualize random forests
- How to evaluate the performance of a random forest
Table of Contents
A Recap on Decision Tree Classifiers
A decision tree classifier is a form of supervised machine learning that predicts a target variable by learning simple decisions inferred from the data’s features. The decisions are all split into binary decisions (either a yes or a no) until a label is calculated. Take a look at the image below for a decision tree you created in a previous lesson:
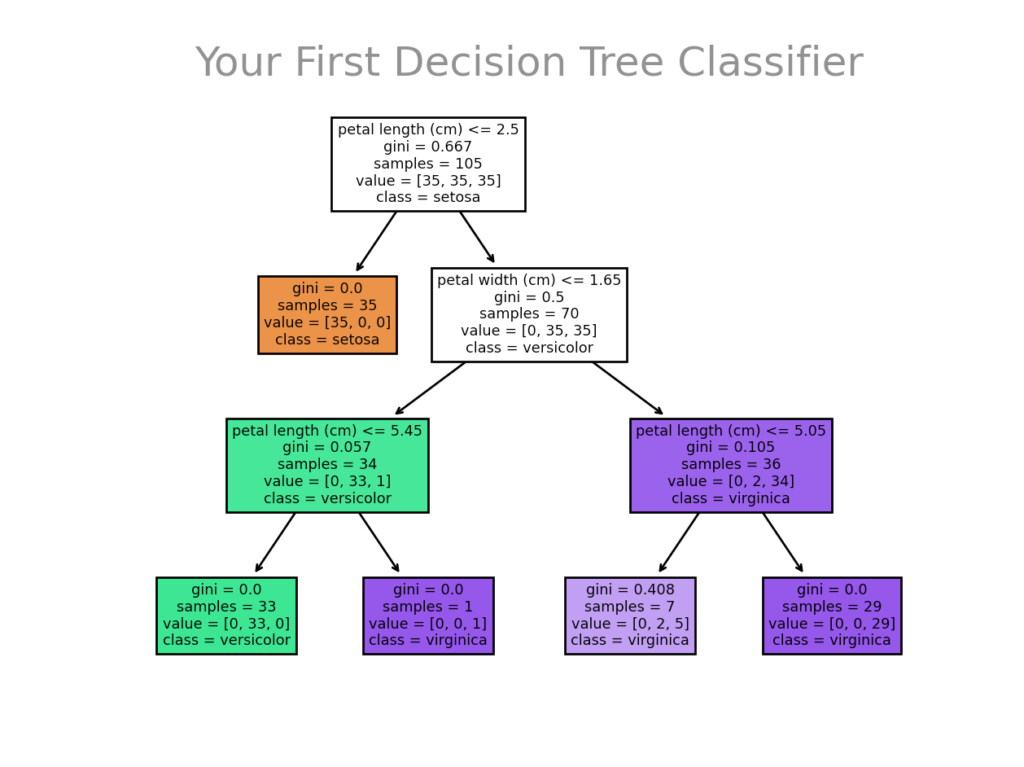
In this tree, you can see that in the first node, the model looks at the petal length. If the length in centimeters is less than or equal to 2.5 cm, the data moves into another node. On the left, a label is reached and the sub-tree ends. On the right, the data splitting continues, this time looking at petal width.
When building a decision tree algorithm, you can set many different parameters, including how deep the tree should be. A deeper tree may mean higher performance for the training data, but it can lead to overfitting. This means that the model performs very well with training data, but may not perform well with testing data.
This is where random forest classifiers come into play. In the next section, you’ll learn what these classifying algorithms are and how they help you with the problem of overfitting your model.
An Overview of Random Forest Classifiers
A random forest classifier is what’s known as an ensemble algorithm. The reason for this is that it leverages multiple instances of another algorithm at the same time to find a result. Remember, decision trees are prone to overfitting. However, you can remove this problem by simply planting more trees!
The idea behind is a random forest is the automated handling of creating more decision trees. Each tree receives a vote in terms of how to classify. Some of these votes will be wildly overfitted and inaccurate. However, by creating a hundred trees the classification returned by the most trees is very likely to be the most accurate.
The image below shows five different decision trees being created. Each of these trees gets a vote and the classification with the most votes is the one that’s returned.
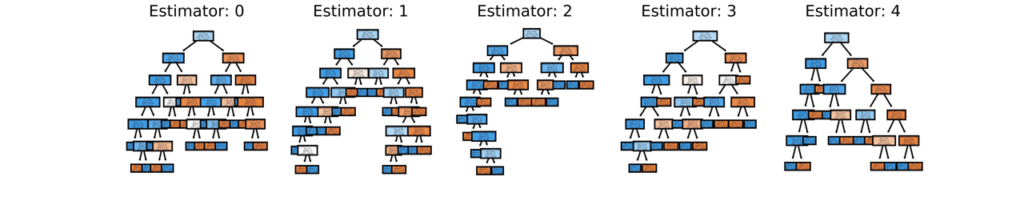
In many cases, however, there are significantly more than five trees being created. In the example you’ll take on below, for example, you’ll create a random forest with one hundred trees!
Loading a Sample Dataset
Let’s start off by loading a sample dataset. In this example, you’ll learn how to create a random forest classifier using the penguins dataset that is part of the Seaborn library. The dataset provides information on three different species of penguins, the Adelie, Gentoo, and Chinstrap penguins. The image below shows an Adelie penguin:

Let’s load the dataset to see what you’re working with:
# Loading the Penguins Dataset from Seaborn
import seaborn as sns
import pandas as pd

df = sns.load_dataset('penguins')
print(df.head())

# Returns:
#   species     island  bill_length_mm  bill_depth_mm  flipper_length_mm  body_mass_g     sex
# 0  Adelie  Torgersen            39.1           18.7              181.0       3750.0    Male
# 1  Adelie  Torgersen            39.5           17.4              186.0       3800.0  Female
# 2  Adelie  Torgersen            40.3           18.0              195.0       3250.0  Female
# 3  Adelie  Torgersen             NaN            NaN                NaN          NaN     NaN
# 4  Adelie  Torgersen            36.7           19.3              193.0       3450.0  Female
The dataset provides a number of data columns, some of which are numeric and others are categorical. In the end, you’ll want to predict a penguins species using the various features in the dataset. Let’s take a look at some of these columns:
# Displaying Info on the Penguins Dataset
print(df.info())

# Returns:
# <class 'pandas.core.frame.DataFrame'>
# RangeIndex: 344 entries, 0 to 343
# Data columns (total 7 columns):
#  #   Column             Non-Null Count  Dtype
# ---  ------             --------------  -----
#  0   species            344 non-null    object
#  1   island             344 non-null    object
#  2   bill_length_mm     342 non-null    float64
#  3   bill_depth_mm      342 non-null    float64
#  4   flipper_length_mm  342 non-null    float64
#  5   body_mass_g        342 non-null    float64
#  6   sex                333 non-null    object
# dtypes: float64(4), object(3)
# memory usage: 18.9+ KB
# None
Machine learning models have some limitations:
- They can’t work with missing data, and
- They can’t work with categorical, string data
By reviewing the information returned by the .info() method, you can see that both of these problems exist in the dataset. In order to be able to use this dataset for classification, you’ll first need to find ways to deal with missing and categorical data. This is exactly what you’ll learn in the next two sections of the tutorial.
Dealing with Missing Data in Scikit-Learn
First, let’s take a look at missing data. Many machine learning models cannot handle missing data. In fact, trying to build a decision tree with missing data (and, by extension, a random forest) results in a ValueError being raised. Because of this, we need to figure out how to handle missing data.
While the .info() method tells us a little bit about non-null data, this can often be harder to interpret. Let’s calculate the number of missing values in each column by chaining the .isnull() and .sum() methods:
# Seeing missing data
print(df.isnull().sum())

# Returns:
# species               0
# island                0
# bill_length_mm        2
# bill_depth_mm         2
# flipper_length_mm     2
# body_mass_g           2
# sex                  11
# dtype: int64
When dealing with missing values, you have two main options:
- Impute the missing values
- Drop the missing records (either column-wise or row-wise)
For the most part, much of the data is there. Scikit-Learn comes with a class, SimpleImputer, that allows you to pass in a strategy to impute missing values. We can, for example, impute any missing value to be the mean of that column. Let’s see how this can be done using Scikit-Learn:
# Imputing missing numerical data
from sklearn.impute import SimpleImputer
import numpy as np

# Create a SimpleImputer Class
imputer = SimpleImputer(missing_values=np.NaN, strategy='mean')

# Fit the columns to the object
columns = ['bill_depth_mm', 'bill_length_mm', 'flipper_length_mm', 'body_mass_g']
imputer=imputer.fit(df[columns])

# Transform the DataFrames column with the fitted data
df[columns]=imputer.transform(df[columns])
Let’s explore what we did here:
- We impoted the
SimpleImputerclass fromsklearn.imputeandnumpy - We instantiated a
SimpleImputerobject looking for missing values that are represented bynp.NaNand asking Scikit-Learn to use the'mean'as its strategy. This means that anynp.NaNvalues will be imputed by the columns mean. - We then use the
.fit()method and pass in the column - Finally, we use the
.transform()method to pass the imputed values to the repective columns
Imputing categorical data can be a lot more complicated, especially when dealing with binary distributions. Because of this, we’ll drop any of the records where sex is missing:
# Dropping missing records in the sex column
df = df.dropna(subset=['sex'])
Now, we can make sure there are no missing data elements in the DataFrame by running our earlier code again:
# Checking that no missing data exists
print(df.isnull().sum())

# Returns:
# species              0
# island               0
# bill_length_mm       0
# bill_depth_mm        0
# flipper_length_mm    0
# body_mass_g          0
# sex                  0
# dtype: int64
In the next section, you’ll learn how to work with categorical data in Scikit-Learn.
Dealing with Categorical Data in Scikit-Learn
Similar to dealing with missing values, machine learning models can also generally only work with numerical data. Because of this, we need to convert our categorical data into numerical data. Let’s deal with the sex variable first. Because the sex variable is binary (either male or female), we can assign the vale of either 1 or 0, depending on the sex. This can be done easily with the .map() Series method.
# Mapping the sex variable to binary values
df['sex int'] = df['sex'].map({'Male': 0, 'Female': 1})
In the code above, you passed a dictionary into the .map() method. The dictionary contained a binary mapping for either 'Male' or 'Female'.
The other categorical value is the 'island' feature. Let’s see what the unique values in this column are:
# Checking unique values in the island feature
print(df['island'].unique())
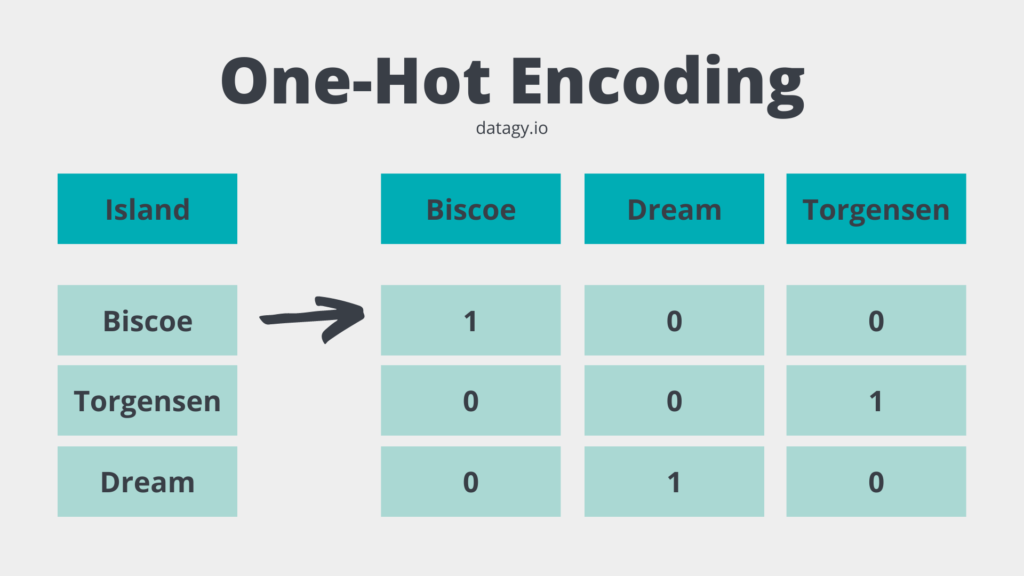
# Returns: ['Torgersen' 'Biscoe' 'Dream']In the case of the 'island' feature, there are three values. Because of this we can’t simply pass in a binary mapping. Similarly, passing in values of 0, 1, 2 would also present problems, because the values don’t actually imply a hierarchy. The difference between 0 and 2 would amplify any decisions our random forest would make.
A simple way to deal with this would be to use a process referred to as one-hot encoding. The unique values of that column are used to create columns where a value of either 0 or 1 is assigned. The image below shows what this process looks like:
Scikit-Learn comes with a helpful class to help you one-hot encode your categorical data. This class is called the OneHotEncoder and is part of the sklearn.preprocessing module. Let’s see how you can use this class to one-hot encode the 'island' feature:
# One-hot Encoding the Island Feature
from sklearn.preprocessing import OneHotEncoder
one_hot = OneHotEncoder()
encoded = one_hot.fit_transform(df[['island']])
df[one_hot.categories_[0]] = encoded.toarray()
Let’s break down what we did here:
- We imported the
OneHotEncoderclass from thesklearn.preprocessingmodule - We then created a
OneHotEncoderobject,one_hot - The
fit_transform()method allowed you to simultaneously fit and transform a column into a one-hot encoded version - The last line created a new set of DataFrame columns.
- The
.categories_attribute contains a list containing an array of the attribute names - The
encodedobject contains the one-hot encoded array. By converting it to an explicit array, the data can be mapped to DataFrame columns
- The
Now that you’ve dealt with missing and categorical data, the original columns can be dropped from the DataFrame. Let’s do this now:
# Dropping Unnecessary Columns
df = df.drop(columns=['island', 'sex'])
In the next section, you’ll learn how to use this newly cleaned DataFrame to build a random forest algorithm to predict the species of penguins!
Creating Your First Random Forest: Classifying Penguins
Now, let’s dive into how to create a random forest classifier using Scikit-Learn in Python! Remember, a random forest is made up of decision trees. But that doesn’t mean that you need to actually create any decision trees! Scikit-Learn can handle this using the RandomForestClassifier class from the sklearn.ensemble module. Let’s begin by importing the required classes.
# Splitting the data and creating a model
from sklearn.model_selection import train_test_split
from sklearn.ensemble import RandomForestClassifier

X = df.iloc[:, 1:]
y = df['species']
X_train, X_test, y_train, y_test = train_test_split(X, y, stratify=y, test_size=0.3, random_state=100)

forest = RandomForestClassifier(n_estimators=100, random_state=100)
Let’s explore what we did in the code above:
- We imported the required classes
- We created our features DataFrame,
X, and our taget Series,y - The data was split using the
train_test_split()function - Finally, we instantiated our model,
forest, using theRandomForestClassifer. We specified to create 100 different decision trees in our forest!
Now it’s time to fit our data to the model. We can do this using the aptly-named .fit() method, which takes the training features and labels as inputs. From there, we can make predictions on our testing data using the .predict() method, by passing in the testing features.
# Fitting a model and making predictions
forest.fit(X_train,y_train)
predictions = forest.predict(X_test)
Evaluating the Performance of a Random Forest in Scikit-Learn
Because we already have an array containing the true labels, we can easily compare the predictions to the y_test array. Scikit-learn comes with an accuracy_score() function that returns a ratio of accuracy. Let’s see how this works:
# Evaluating the model
from sklearn import metrics
print("Accuracy:",metrics.accuracy_score(y_test, predictions))

# Returns: Accuracy: 0.97
This shows that our model is performing with 97% accuracy!
It’s important to note that accuracy is just a single criterion for evaluating the performance of a classification problem. If you want to learn more about this, check out my in-depth post on calculating and visualizing a confusion matrix in Python.
Want to learn about a more efficient way to optimize hyperparameters? You can optimize and speed up your hyperparameter tuning using the Optuna library.
Visualizing Random Forest Decision Trees in Scikit-Learn
One of the difficulties that you may run into in your machine learning journey is the black box of machine learning. Because libraries like Scikit-Learn make it so simple to create a random forest, it can be helpful to look at some of the details of your model.
One way of doing this is by actually analyzing the patterns that the decision trees that make up the model look like. It may not be practical to look at all 100, but let’s look at a few of them.
import matplotlib.pyplot as plt
from sklearn.tree import plot_tree

fig = plt.figure(figsize=(15, 10))
plot_tree(forest.estimators_[0],
          feature_names=X.columns,
          class_names=df['species'].unique(),
          filled=True, rounded=True)

plt.show()
In the code above, we imported the matplotlib.pyplot library and the plot_tree function. The plot_tree() function required us to provide a tree to plot. Here, we could access a tree from our random forest by using the .estimators_ property which holds all the trees. The feature_names are the columns of our features DataFrame, X. The class_names are our unique species.
The two images below show the first (estimators_[0]) tree and the twelfth (estimators_[11]) tree.

The image below shows the twelth decision tree in the random forest. This tree uses a completely different feature as its first node.

Conclusion and Recap
In this tutorial, you learned how to use random forest classifiers in Scikit-Learn in Python. The section below provides a recap of what you learned:
- Random forests are an ensemble machine learning algorithm that uses multiple decision trees to vote on the most common classification
- Random forests aim to address the issue of overfitting that a single tree may exhibit
- Random forests require all data to be numeric and non-missing
- They can generally be more accurate, though also more memory-consuming than single decision trees
Additional Resources
To learn more about related topics, check out the tutorials below:
hi nik! This was an amazing lesson. I wanted to ask why I got only one image of the two, (the last one) and not also the first
Hi Chis, thanks so much for your comment! In my KNN tutorial, I provide more of an overview of what the different variables mean. You can check it out here: http://datagy.io/python-knn/
Also, what exactly do the images show in related to the penguins?
I made it through the 30 days…whoooo!!
I appreciated this series very much. my question is, where do I go from here? Do you have other courses, where we can practice and continue to grow our PY knowledge?
That’s amazing, James!! Great work :). I’m really glad you enjoyed it. I am working on some further courses, but they won’t be ready for a while. I do have a number of guided learning paths, depending on what you’re hoping to learn, including:
– Pandas: this post provides a jumping-off point to many, many different posts: http://datagy.io/pandas/
– Seaborn for data visualization: if you’re interested in learning more about creating visualizations: http://datagy.io/learn-seaborn/
– Machine learning: http://datagy.io/category/machine-learning/
– NumPy: http://datagy.io/learn-numpy/
– Python Requests (for web requests): http://datagy.io/python-requests/
– Working with files in Python: http://datagy.io/python-file-handling/
– The Python Collections library: http://datagy.io/python-collections/
If you’re open to it (no pressure!), I would love it if you left a testimonial for the course.